Know what you’re seeing.
Understand Alerts, Signals, and Insights—one short guide at a time.
From alert to understanding.
Explore Alerts, review Signals, and read Insights. Save markets to your Watchlist and choose your notifications.
Start here ↗
Start Here
Learn the basics, then explore a market condition or strategy.
Alerts and Signals
Learn what an alert tells you, what a Signal adds, and where to start in V3.

Candlesticks and Timeframes
Read candle bodies, wicks and intervals without losing the bigger picture.

Risk and Position Sizing
Connect your loss budget, stop distance and position size.
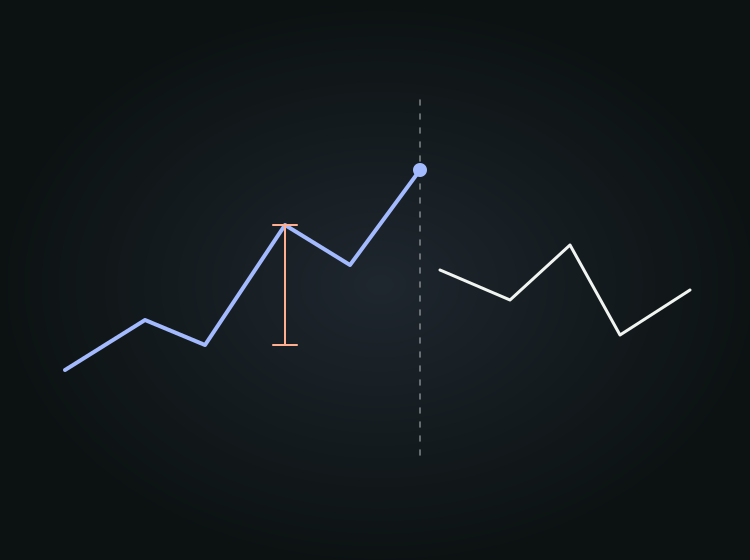
Backtests and Live Results
Compare historical evidence, drawdowns and live observations fairly.
Market Alerts
Learn what each condition reveals, and where it can mislead.

Unusual Volume
Read a jump in trading activity without assuming a price direction.

Open Interest
Separate contract changes from dollar value, then compare both with price.
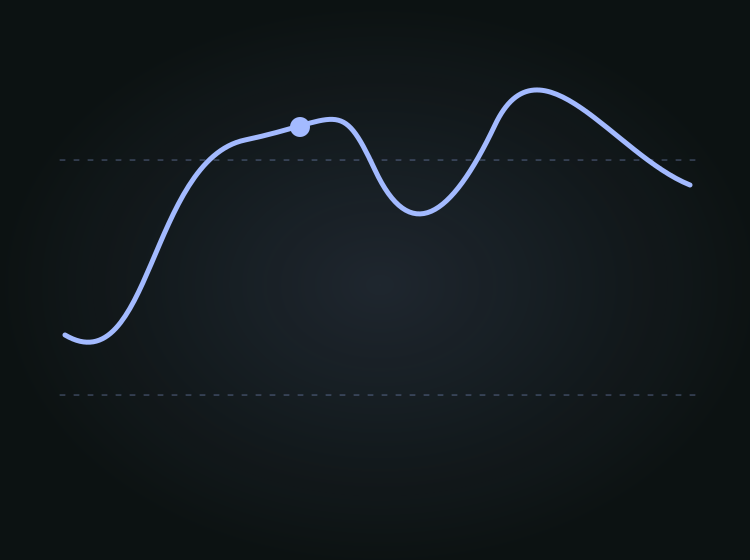
RSI: Overbought and Oversold
Understand momentum extremes and why they can persist.
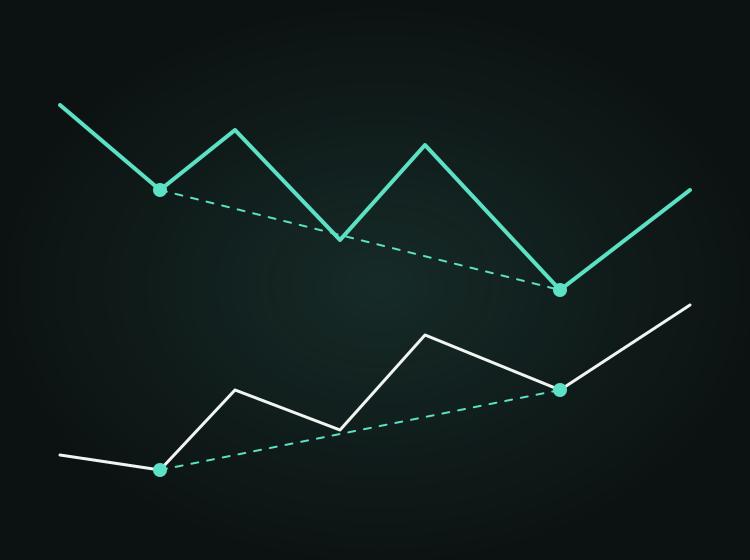
RSI Divergence
See what changes when price and momentum disagree.
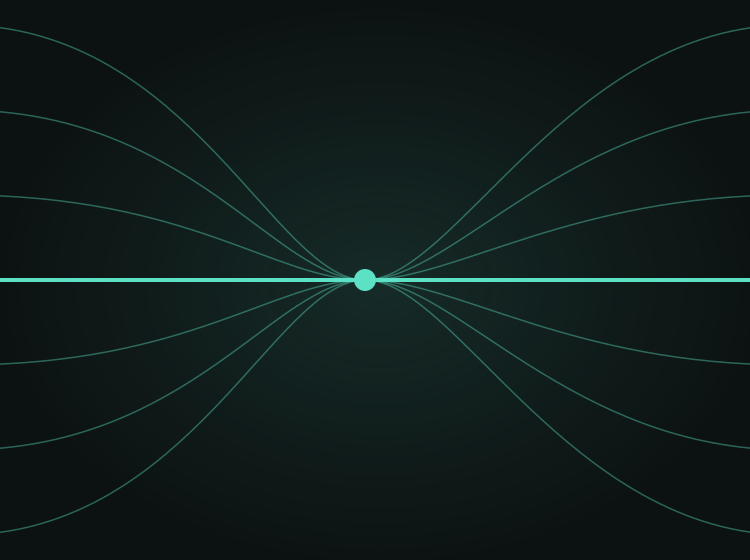
Volatility Squeezes
Distinguish compression, release and expansion without predicting direction.

Moving Average Crosses
Read Golden Cross, Death Cross and 200 EMA Breakdown alerts.

Range Breakouts
Check a close beyond the range and what the evidence actually shows.
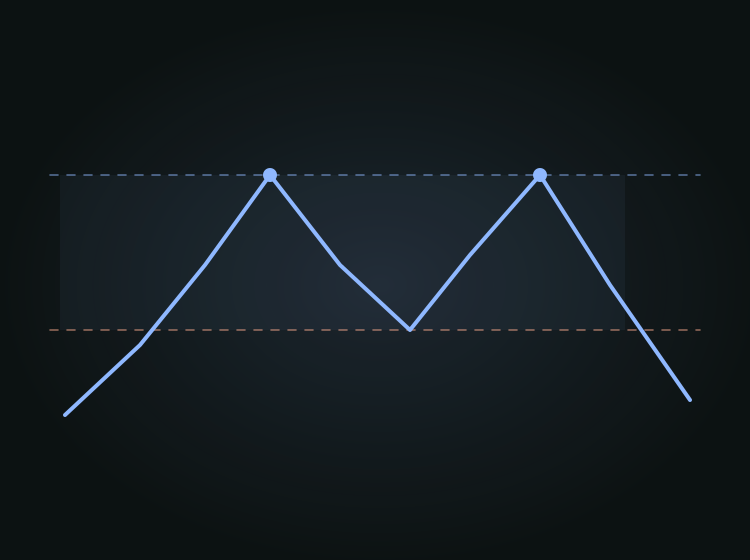
Double Tops and Bottoms
Check two or three turns at the same level and what the evidence actually shows.
Signals
Learn to use Polaris, manage risk and review its performance.
Track live paper performance ↗
Polaris Gold Signals
Find Polaris Gold signals, plan your risk and check historical and live performance.
Polaris Blue Signals
Find Polaris Blue signals, plan your risk and check historical and live performance.
Polaris Meme Signals
Find Polaris Meme signals, plan your risk and check historical and live performance.
Insights
Understand the market beyond individual events.