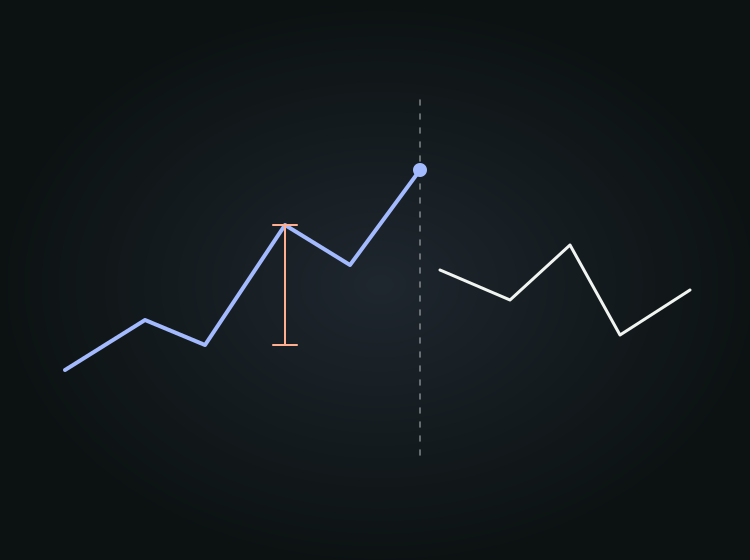
What Polaris Blue offers
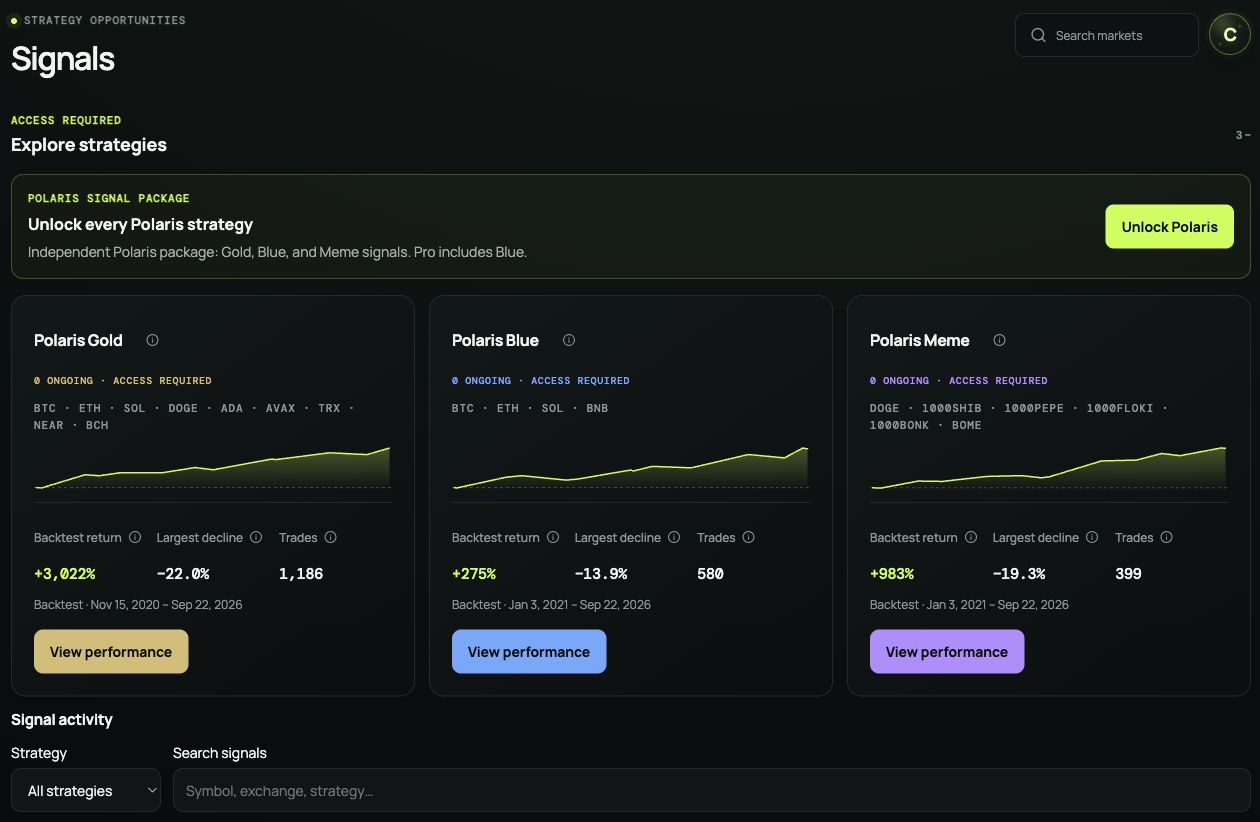
Polaris Blue is a CoinScreener strategy product focused on a narrower selection of large crypto markets. The public list verified on 5 September 2026 is BTC, ETH, SOL and BNB. Check the current strategy panel for changes before assessing a new setup.
Blue offers long and short opportunities across its portfolio. Do not assume both sides apply to every listed market. The side on the specific Signal tells you what that setup proposes.
The name describes a distinct strategy product, not a risk rating. Concentrating on fewer markets does not establish a guaranteed return, smaller drawdown or a better fit for a particular account.
What the setup shows
The Signal presents the strategy name, market, direction and reference trade levels. A long setup benefits from a rise after entry; a short benefits from a decline. Read the entry, stop and any published target together. If no fixed target is provided, do not infer one or assign a target-based reward-to-risk ratio.
An alert such as RSI Oversold describes a market condition. A Blue Signal adds a strategy's reference trade plan. Use the strategy name and displayed levels to identify which you are reading.
Practise the levels
Use the lesson to compare long and short entries, a stopped-out trade and a late entry. These are hypothetical examples of how trade levels work, rather than Blue strategy outputs.
Before the setup
This hypothetical example will introduce an entry, stop and target. Watch when the levels become available, then compare the different outcomes. It is not a Polaris Signal.
Illustrated walkthrough · all scenarios
Long setup
- Before the setup. This hypothetical example will introduce an entry, stop and target. Watch when the levels become available, then compare the different outcomes. It is not a Polaris Signal.
- A hypothetical trade plan. The original idea has entry 100, stop two price units away and target four units away: 2:1 reward-to-risk before costs. A stop is an intended exit, not a guaranteed fill.
- Manage the risk you planned. An open trade's gain or loss is not a closed result. Review actual fills and total exposure; the chart cannot decide an appropriate size for your account.
- The target is crossed. The candle reaches the hypothetical target. The line crossing alone is not proof of your fill. Verify the trade status, execution and costs.
Short setup
- Before the setup. This hypothetical example will introduce an entry, stop and target. Watch when the levels become available, then compare the different outcomes. It is not a Polaris Signal.
- A hypothetical trade plan. The original idea has entry 100, stop two price units away and target four units away: 2:1 reward-to-risk before costs. A stop is an intended exit, not a guaranteed fill.
- Manage the risk you planned. An open trade's gain or loss is not a closed result. Review actual fills and total exposure; the chart cannot decide an appropriate size for your account.
- The target is crossed. The candle reaches the hypothetical target. The line crossing alone is not proof of your fill. Verify the trade status, execution and costs.
Stopped out
- Before the setup. This hypothetical example will introduce an entry, stop and target. Watch when the levels become available, then compare the different outcomes. It is not a Polaris Signal.
- A hypothetical trade plan. The original idea has entry 100, stop two price units away and target four units away: 2:1 reward-to-risk before costs. A stop is an intended exit, not a guaranteed fill.
- Manage the risk you planned. An open trade's gain or loss is not a closed result. Review actual fills and total exposure; the chart cannot decide an appropriate size for your account.
- The stop is crossed. The candle trades through 98. Real execution can be worse than the stop price because of gaps, slippage or liquidity. A losing outcome must fit the risk budget.
Late entry
- Before the setup. This hypothetical example will introduce an entry, stop and target. Watch when the levels become available, then compare the different outcomes. It is not a Polaris Signal.
- A hypothetical trade plan. The original idea has entry 100, stop two price units away and target four units away: 2:1 reward-to-risk before costs. A stop is an intended exit, not a guaranteed fill.
- The price has already moved. Entering at 102 with the original stop at 98 and target at 104 risks 4 to seek 2: only 0.5:1 before costs. The old reward-to-risk no longer describes this entry.
- The target is crossed. The candle reaches the hypothetical target. The line crossing alone is not proof of your fill. Verify the trade status, execution and costs.
The late-entry scenario keeps the hypothetical stop and target while moving the possible entry. Buying at 102 with a stop at 98 risks 4, while a target at 104 offers 2 before costs. Compare that with the original entry at 100, which risked 2 to seek 4.
Timing and holding duration
As checked on 5 September 2026, Blue evaluates for new setups on a one-hour schedule. That tells you when it checks, not how often a Signal appears or how long a trade lasts. The chart interval you view is a separate choice and does not reconfigure the published strategy.
Quiet periods can be normal. If the product shows an average number of Signals per month, read it with its date range. The actual Signals may have arrived in clusters rather than at regular intervals.
How to use Blue practically
- Verify Blue, the market, side and trigger time.
- Compare the current price with the reference entry and recalculate the distance to the stop and any target.
- Identify nearby price obstacles and execution conditions on the venue you would use.
- Size from the actual stop distance, costs and a personal loss budget.
- Check concentration: how much of the account is already sensitive to BTC, ETH, SOL, BNB or the broader crypto market?
- Inspect published evidence for Blue itself, then decide whether to trade or skip.
- Track actual fills and position status separately from the product's reference record.
For example, if you already hold ETH and SOL longs, another Blue long may add to an existing broad-market exposure. The fact that it arrives as a separate notification does not make its risk independent.
Blue and Gold together
Blue's verified market list overlaps with Gold's. Following both does not automatically provide diversification. You could receive related ideas in the same market or accumulate multiple positions sensitive to one move.
Assess the combined size and direction, not just which product label appears on each card. Avoid taking the same exposure twice because two strategy names make it feel like two independent confirmations.
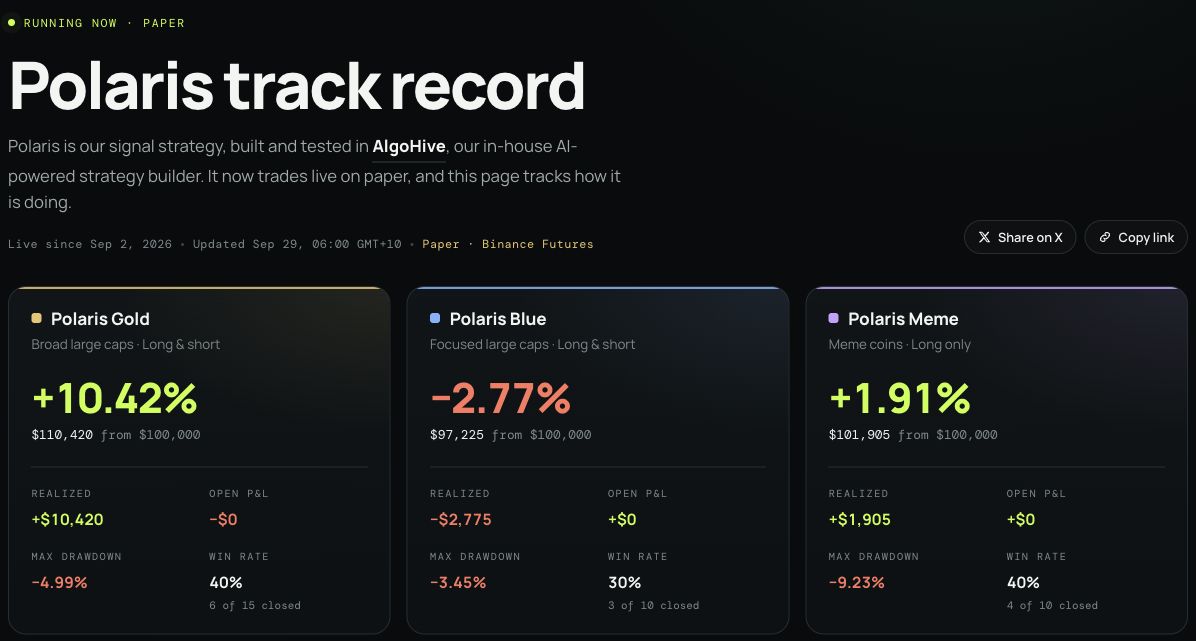
Use each strategy's own published results for comparison. A wider market list, different sample or different historical period can change the interpretation of headline return. Do not infer Blue's performance from Gold's guide.
When to wait or skip
Wait if you cannot see the complete setup or understand the instrument. Skip if the current entry has moved too far, existing exposure is already concentrated, or costs leave too little potential reward.
Even large markets can move too quickly for an order to fill near the intended price. If you cannot obtain a workable entry within your loss budget, letting the trade pass is a valid decision.
Reading Blue's evidence
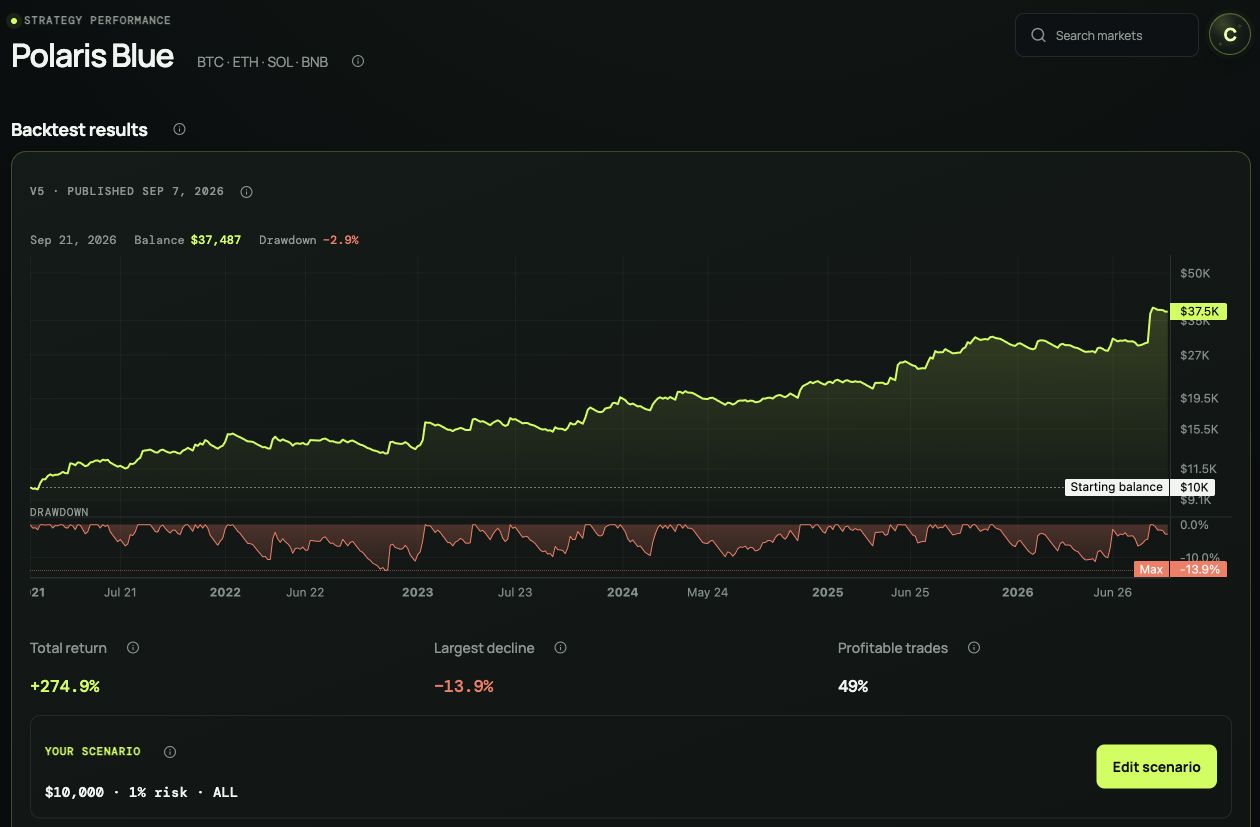
Use the current strategy Performance view to inspect the published version, dates, markets and assumptions. Review the trade list and drawdowns rather than ranking the product by one headline number.
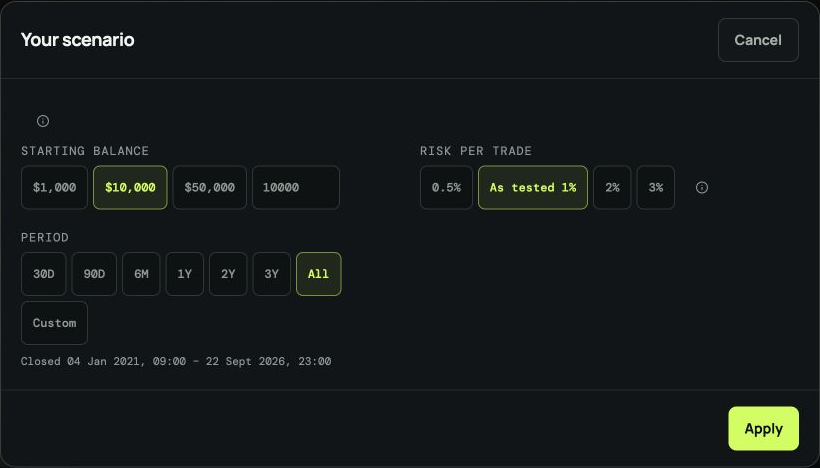
Read live observations separately from historical simulation, including how each handles open trades and costs. The screenshot below is a dated example of Blue's Performance view. Use the current version and date range in the app for your assessment.

Inspect Blue’s own evidence and assumptions before comparing it with Gold. The equity and drawdown panels answer different questions; the figures here are a dated historical simulation, not a forecast or an account balance.
A Blue checklist
- Verify market, direction and a still-practical entry.
- Review size and total concentration across the account.
- Check overlap with Gold and any discretionary trades.
- Inspect Blue's own evidence and assumptions.
- Treat quiet periods and skipped trades as normal possibilities.
Common questions
Is Blue safer because it covers fewer markets? Not necessarily. Fewer markets can increase concentration, and actual risk depends on positions, size, execution and market conditions.
Does Blue provide a trade every hour? No. Evaluation cadence is not trade frequency.
Can I combine Blue with Gold? You can assess both products, but first check overlapping markets and total exposure. Two labels do not establish two independent risks.
Product references
Public market coverage and strategy information were checked on 5 September 2026. Consult the current strategy panel and Performance view for updates. Continue with position sizing and reading historical evidence.