What it means
Trading volume measures how much changed hands during an interval. A volume bar under a one-hour price candle describes activity during that same hour. It should be compared with equivalent intervals and the same market, not with the daily volume of a different exchange.
A spike is meaningful relative to a baseline. A large dollar total might be ordinary for a major market, while a much smaller number could be exceptional for a less active one. Unusual volume asks whether this market's activity stands out against its own recent history.
For example, 3 million in turnover is three times a reference average of 1 million. The same 3 million would be below average in a market that usually trades 10 million per interval. Those are hypothetical comparisons, not alert thresholds.
Volume can be expressed in base units, quote currency or contracts. Know which measure you are reading. A dollar-denominated total also reflects price: the same number of coins traded at a higher price produces a larger quote total.
A spike shows more trading took place. It can appear during a breakout, a sell-off, a reaction to news, liquidation activity or a failed attempt to leave a range. It does not tell you how many distinct traders participated or why they traded.
In CoinScreener
CoinScreener provides Unusual Volume alerts on 5m, 15m, 1h and 4h. Choose an interval appropriate to the decision and the time you can devote to monitoring it. There is no universally best interval. Costs and delays can consume a larger share of a small, short-lived move.
The Unusual Volume detail shows the market, timeframe, chart and evidence cards. Value traded measures turnover in the currency used to price the market, such as USDT. Versus average compares that turnover with a reference level: 3× means three times that level. How unusual puts the difference in context with recent variation; its z-score measures distance from the reference average in standard-deviation units.
Neither a ratio nor a z-score is a probability that a trade will win. Read these measurements as context for the activity alert. The received timestamp can be later than the analysed candle close, so evaluate the price currently available.
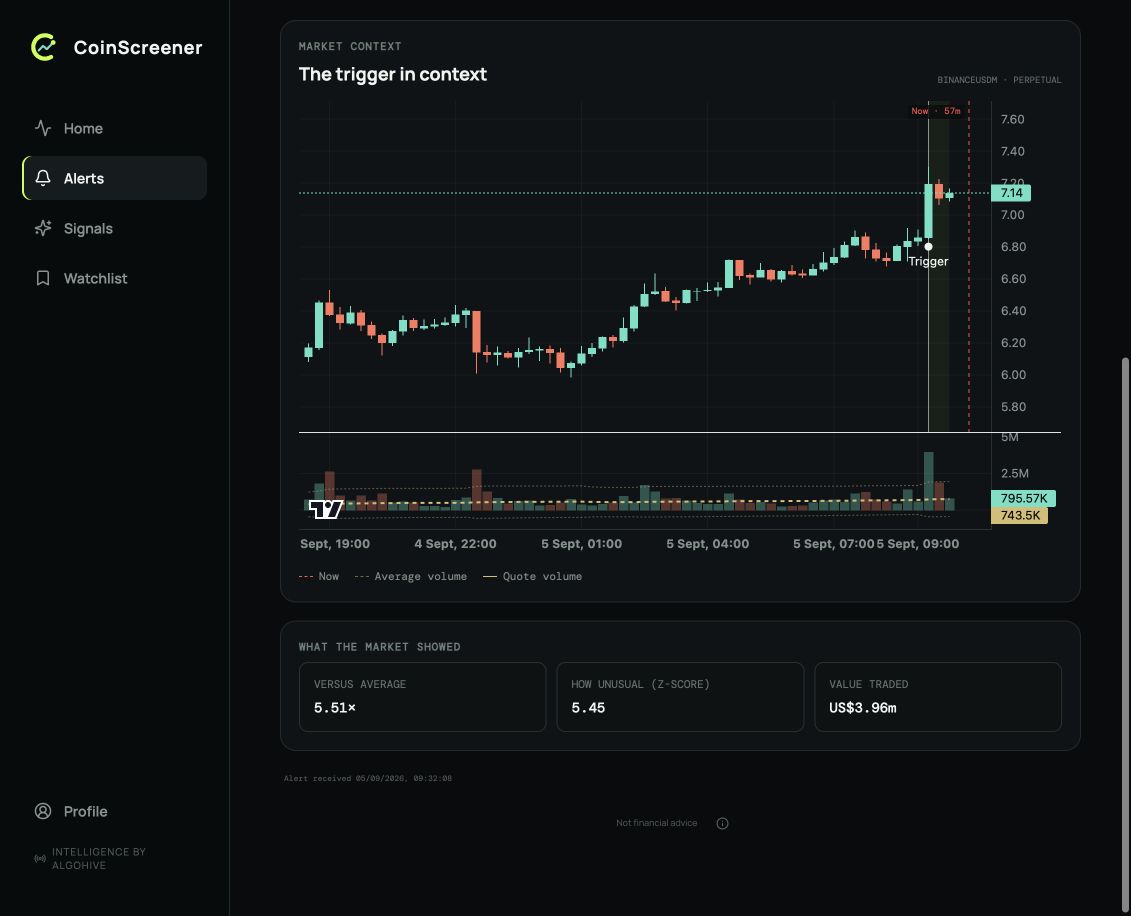
Compare the 1000BONKUSDT five-minute volume spike with its average, then read Versus average and How unusual. This capture ends at the trigger candle; it does not show the later outcome.
Three checks
- Find the location. Is price leaving a range, testing an area where declines previously stopped (support), or approaching an area where rallies stalled (resistance)?
- Check the activity. Confirm the venue, market, interval and units. Look for an actual change from the recent baseline.
- Define invalidation and risk. State what would disprove the idea, then size from the distance to that exit. Allow for slippage in a fast market.
Explore examples
Explore the chart lesson
Both scenarios begin with the same quiet range and activity spike. Play the chart, then switch to Move fades to see why the initial observation cannot settle the outcome.
Ordinary activity
Compare activity with the market's own recent history. Units and candle intervals must match.
Illustrated walkthrough · all scenarios
Move continues
- Ordinary activity. Compare activity with the market's own recent history. Units and candle intervals must match.
- Volume jumps. The volume bar is much larger than its neighbours. This shows more trading, not whether buyers will sustain the move.
- Check the price response. Price is above the earlier range. Watch whether it holds there, then consider where the breakout idea would fail and how much risk that leaves from the available entry.
- Price holds above the range. Price follows through here. The same initial activity can have a different outcome; switch scenarios to compare.
Move fades
- Ordinary activity. Compare activity with the market's own recent history. Units and candle intervals must match.
- Volume jumps. The volume bar is much larger than its neighbours. This shows more trading, not whether buyers will sustain the move.
- Check the price response. Price is above the earlier range. Watch whether it holds there, then consider where the breakout idea would fail and how much risk that leaves from the available entry.
- Activity did not guarantee follow-through. The breakout fades, even though activity increased. This is why activity alerts need price context and a plan for failure.
Watch what happens after the spike: does price stay outside the old range or fall back inside? The hypothetical examples share the same opening move, so the outcome is something you must wait to observe.
Sources
Product behavior checked against V3 source on 9 September 2026. Screenshots retain their original capture dates.