What it means
Open interest, usually shortened to OI, is the number of derivative contracts that remain open rather than closed or settled. It is a measure of outstanding positions. Trading volume measures the amount traded during a period; OI measures what is still outstanding at a point in time.
In a single-sided count, each contract counts once, even though it has two sides. If OI rises from 1,000 to 1,100 contracts, there are 100 more open contracts. The increase does not mean there are 100 more longs than shorts.
Spot trading volume is not futures OI. Always identify the market and venue before combining measurements. Contract counts and dollar-valued OI also differ: dollar OI can change partly because the underlying price changed, even when the contract count did not.
OI quantity may be reported in base-asset units, such as BTC, rather than a whole-number contract count. When comparing Binance and Bybit, match units and single-sided versus double-sided counting first; dollar totals are not interchangeable with quantities.
When measured by quantity, rising OI means more remains open; falling OI means less. Neither alone establishes whether the new exposure is bullish, bearish, hedged or likely to be profitable.
In CoinScreener
CoinScreener uses Binance data for Unusual Open Interest alerts on 5m, 15m, 1h and 4h. Daily and weekly OI alerts are not currently supported. This is a product/data-coverage limit, not a statement that OI cannot be studied over longer horizons.
An Unusual Open Interest alert can reflect an unusually high or low USD value, a large change in contract quantity, or both. Read OI value vs average separately from Contracts change: 1× means average USD value, while contracts change compares the amount held open with the previous interval. Dollar value can rise with price even when contract quantity stays flat. Neither measure identifies which side will win.
These are descriptive measurements, not probabilities or long/short recommendations. Check the chart and candle-close time, then review what price has done since the observation. An OI alert is a market condition, not a Polaris trade setup.
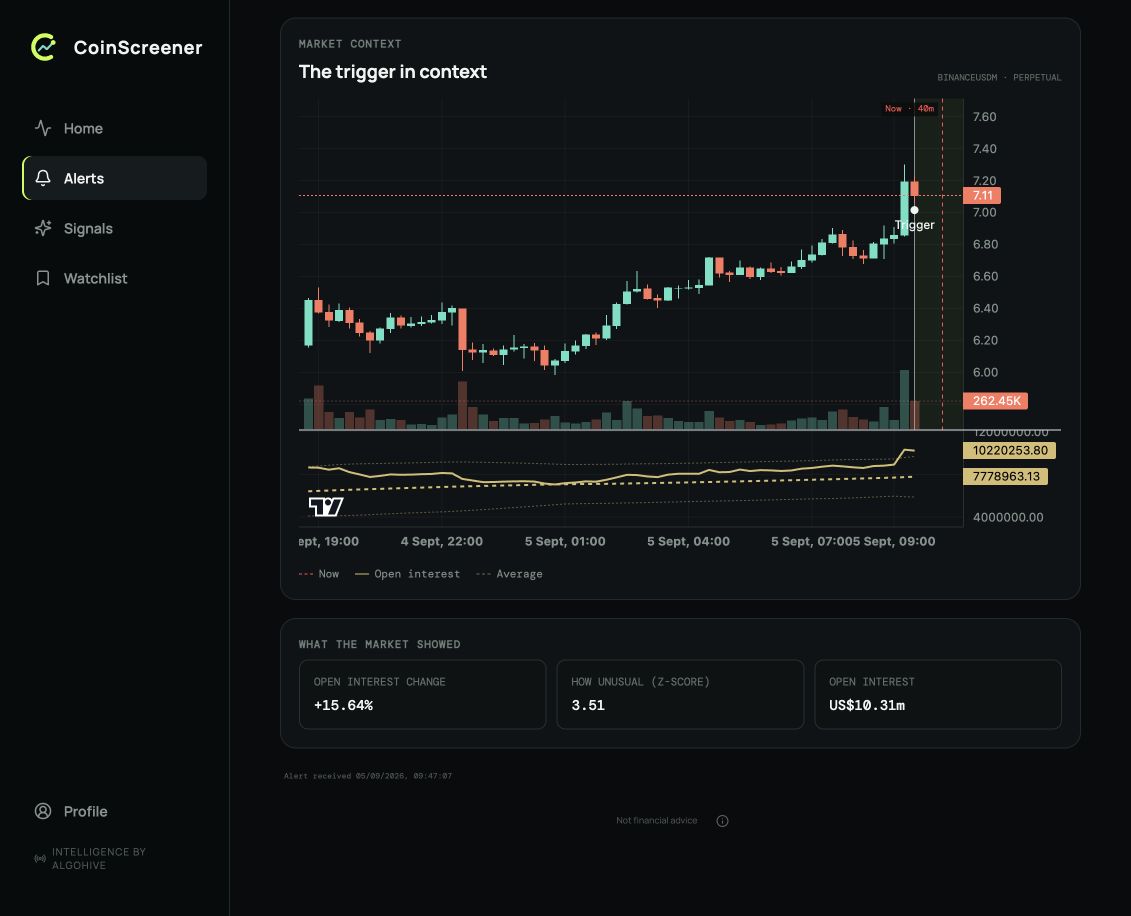
Read the open-interest line separately from price and volume. The evidence cards describe the alert at its trigger; values at the right edge of the chart can reflect a later observation.
Three checks
- Identify the data. Confirm whether OI is measured in contracts or dollars and which derivative market it represents.
- Locate price. Is the change happening near a range boundary, after an extended move or during a fast reversal?
- Evaluate execution and risk. A volatile derivative market can move through a stop. Consider spreads, leverage, fees and funding, then size from an explicit loss budget.
Explore examples
Explore the chart lesson
The OI line grows in both scenarios. In one, price continues higher; in the other, it falls back. The example is intentionally built to show that the same OI direction can accompany different price outcomes.
Ordinary activity
Compare activity with the market's own recent history. Units and candle intervals must match.
Illustrated walkthrough · all scenarios
Move continues
- Ordinary activity. Compare activity with the market's own recent history. Units and candle intervals must match.
- More contracts remain open. The OI line rises. Every contract has a long and a short side; this increase alone does not establish which direction price will travel.
- Check the price response. Price is above the earlier range. Watch whether it holds there, then consider where the breakout idea would fail and how much risk that leaves from the available entry.
- Price holds above the range. Price follows through here. The same initial activity can have a different outcome; switch scenarios to compare.
Move fades
- Ordinary activity. Compare activity with the market's own recent history. Units and candle intervals must match.
- More contracts remain open. The OI line rises. Every contract has a long and a short side; this increase alone does not establish which direction price will travel.
- Check the price response. Price is above the earlier range. Watch whether it holds there, then consider where the breakout idea would fail and how much risk that leaves from the available entry.
- Activity did not guarantee follow-through. The breakout fades, even though activity increased. This is why activity alerts need price context and a plan for failure.
OI is shown in hypothetical contracts here. The volume bars are separate; do not read them as additional outstanding contracts.
For funding costs alongside price and OI, read Positioning.
Sources
Product behavior checked against V3 source on 9 September 2026. Screenshots retain their original capture dates.