What it means
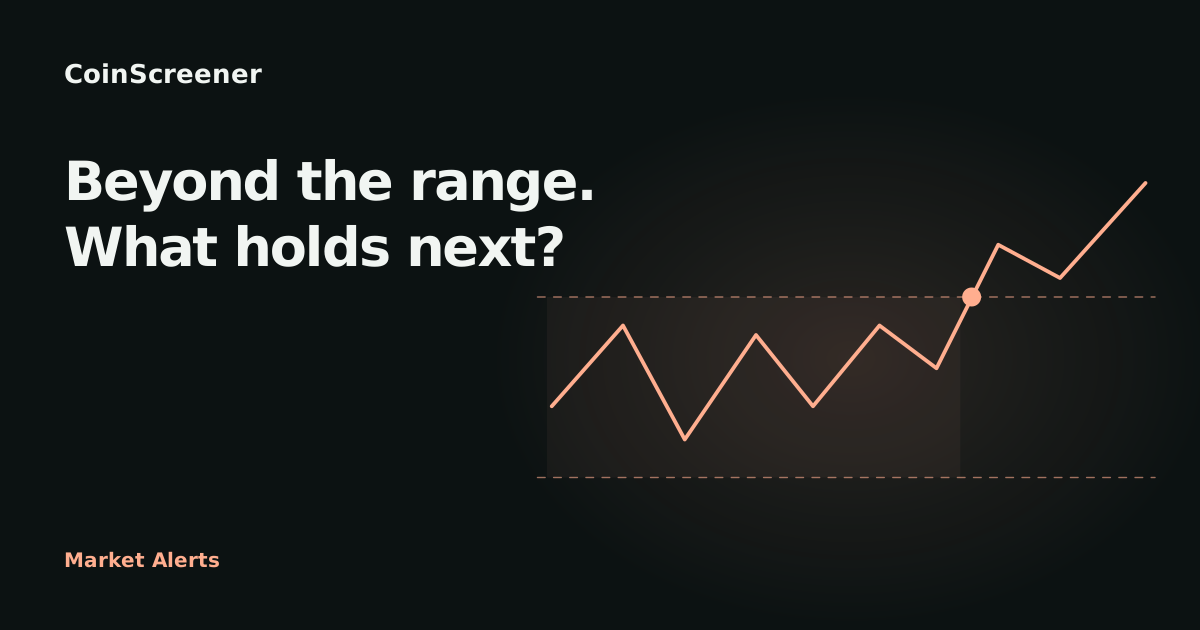
A rolling range uses the highest high and lowest low of a chosen number of candles, the basis of a Donchian channel. CoinScreener compares a completed candle's close with the range before that candle. The trigger candle is excluded. A wick through the boundary or a close exactly at it does not qualify. See candlesticks and timeframes for the basics.
The market does not need to consolidate sideways first. A trending market can also make a fresh rolling high or low.
Range Breakout requires a close strictly above the prior range's highest high, including its wicks. On 4h, this means the previous 42 four-hour candles (7 days). On 1D, it means the previous 30 daily candles (30 days). Weekends count.
High volume is not required. The alert records the broken level, the percentage above it, and volume evidence.
Range Breakdown is the downward counterpart: a close strictly below the prior range's lowest low. It uses the same lookbacks on each timeframe. A low of 100 followed by a close of 95 is 5% below the range bottom.
It highlights a bearish price event. A rebound that reclaims the old range bottom weakens the continuation idea; the alert does not provide an entry, stop, target or promised return.
In CoinScreener
Both alerts support 4h and 1D. The four-hour alert tracks a 7-day range · 4h close; the daily alert tracks a 30-day range · Daily close. They answer different questions about shorter and broader price moves. Match the exchange, market, timeframe and lookback when comparing another chart.
Open Alerts, select Range Breakout or Range Breakdown, then choose 4h or 1D in the signed-in feed.
- Range top / Range bottom: the previous window's highest high or lowest low.
- Above the range top / Below the range bottom: the distance beyond the broken boundary as a percentage of that boundary. A close of 52 above 50 is 4%; a close of 95 below 100 is 5%.
- Volume (z-score): how far the candle's quote volume is from its recent average in standard deviations. A score of 2 means two standard deviations above average, not twice the volume or a probability of success.
The chart draws both rolling boundaries. Read the boundary at the trigger candle, not its later position.
The first qualifying close can generate an alert. Consecutive qualifying closes do not keep sending alerts while the condition remains active. After it clears, another qualifying close can alert only when at least three candles have elapsed since the last emitted alert. Rechecking the same candle does not produce a duplicate.
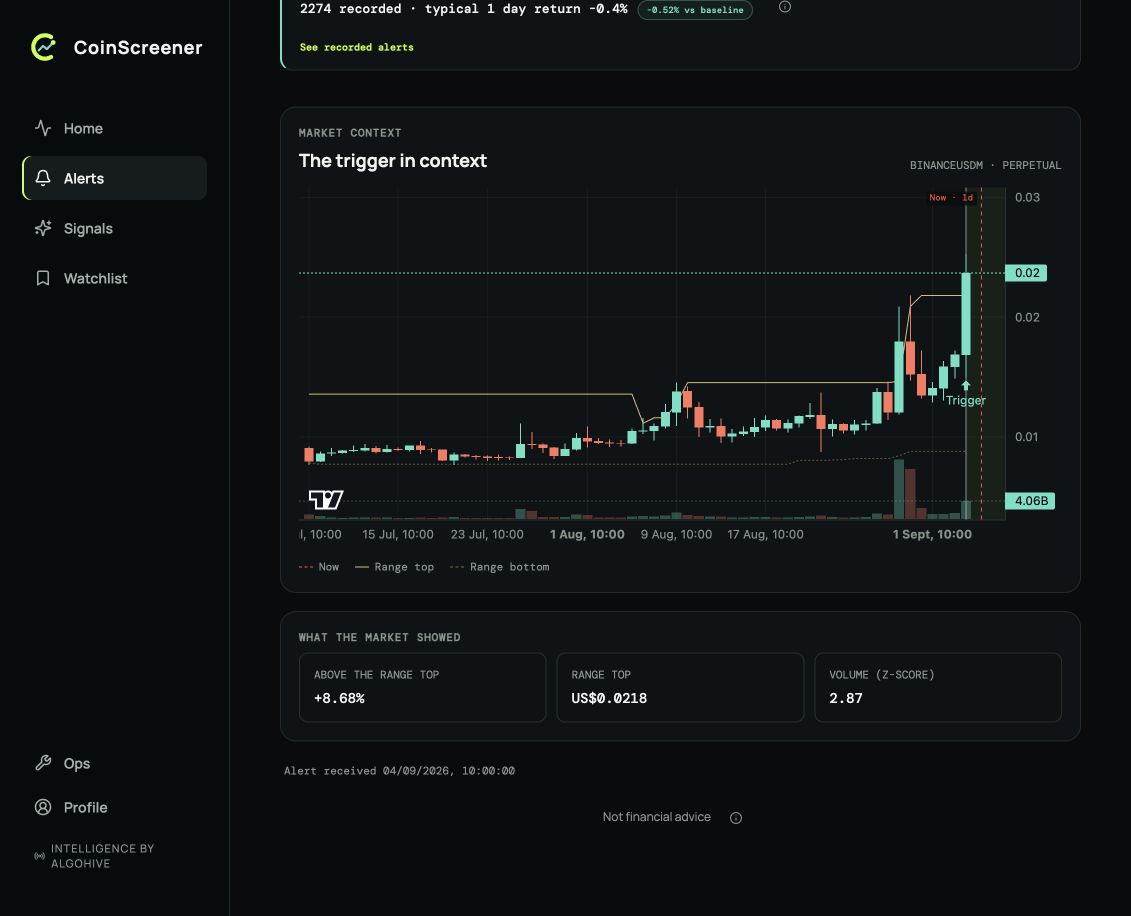
A recorded 4USDT daily Range Breakout. Compare the trigger candle with the range boundaries, then read the evidence: 8.68% above the range top of 0.0218 and a volume z-score of 2.87. This is a historical replay example, not a live notification.
Three checks
- Confirm a completed close beyond the prior boundary; a wick or an equal close is insufficient.
- Read volume as context. A high reading is neither required for this alert nor proof that the move will hold.
- Compare the current price with the trigger and define your own exit and size before considering a trade.
Explore examples
Explore the chart lesson
Select Break holds, Break fails or Break down, then step through the candles. This illustration uses a shorter 10-candle range so the examples fit on one chart. The product uses 42 four-hour candles or 30 daily candles.
A range with a top and a bottom
The dashed lines show the highest high and lowest low of the previous 10 candles. Each step adds the newly completed candle to the next range and removes the oldest one. CoinScreener uses 42 four-hour candles or 30 daily candles.
Illustrated walkthrough · all scenarios
Break holds
- A range with a top and a bottom. The dashed lines show the highest high and lowest low of the previous 10 candles. Each step adds the newly completed candle to the next range and removes the oldest one. CoinScreener uses 42 four-hour candles or 30 daily candles.
- A close above the range. The candle closes above the old range top. Note this boundary before advancing: the range line will update on the next step. The larger volume bar shows more trading, not a guaranteed continuation.
- Check the original boundary. Compare price with the boundary at the first breakout, not just the updated dashed line. A return to that old level is a retest. Has price stayed beyond it or moved back inside?
- The move continues here. Price keeps going in this hypothetical case. That was not known at the break. Compare the failed example before treating a breakout as an entry on its own.
Break fails
- A range with a top and a bottom. The dashed lines show the highest high and lowest low of the previous 10 candles. Each step adds the newly completed candle to the next range and removes the oldest one. CoinScreener uses 42 four-hour candles or 30 daily candles.
- A close above the range. The candle closes above the old range top. Note this boundary before advancing: the range line will update on the next step. The larger volume bar shows more trading, not a guaranteed continuation.
- Check the original boundary. Compare price with the boundary at the first breakout, not just the updated dashed line. A return to that old level is a retest. Has price stayed beyond it or moved back inside?
- Back inside the range. Price is back inside the original range. This example began with the same upward breakout candle as Break holds, but the outcome differs. Compare it with the exit condition in your plan.
Break down
- A range with a top and a bottom. The dashed lines show the highest high and lowest low of the previous 10 candles. Each step adds the newly completed candle to the next range and removes the oldest one. CoinScreener uses 42 four-hour candles or 30 daily candles.
- A close below the range. The candle closes below the old range bottom. CoinScreener supports upward and downward range alerts on 4h and 1D. The larger volume bar shows more trading, not a guaranteed continuation.
- Check the original boundary. Compare price with the boundary at the first breakout, not just the updated dashed line. A return to that old level is a retest. Has price stayed beyond it or moved back inside?
- The move continues here. Price keeps going in this hypothetical case. That was not known at the break. Compare the failed example before treating a breakout as an entry on its own.
On the next step, the latest candle joins the window and the oldest drops out. The lines may move as extremes enter or leave. Record the original boundary at the alert candle. A return to a broken level is a retest; price can continue without one, and a retest can fail.
Sources
Product behavior checked against V3 source on 9 September 2026. Screenshots retain their original capture dates.