What it means
RSI measures the balance of recent upward and downward closing-price changes on a scale from 0 to 100. Price tells you where the market went; RSI gives you another view of the momentum behind that move. Compare two distinct price swings and the RSI values at those same times. Comparing unrelated points can manufacture a pattern that is not really there.
Price makes a lower low while RSI makes a higher low. Sellers pushed price below the previous swing low, but recent downward momentum was less intense at the second low.
That can suggest selling pressure is weakening. It does not tell you that buyers have taken control. In a strong downtrend, price can make another lower low and continue falling despite several bullish divergences.
Price makes a higher high while RSI makes a lower high. Buyers pushed to a new price high, but recent upward momentum did not strengthen in the same way.
This can be a warning that a rally is losing momentum. It is not an instruction to short immediately. Strong trends can continue while RSI weakens. A trader already holding a long position might use the warning to reassess exposure; another trader might wait for price to break support before considering a bearish setup.
In CoinScreener
CoinScreener currently provides bullish and bearish RSI divergence alerts on 4h and 1D. These are product-supported intervals, not a claim that divergence cannot exist elsewhere. A 4h divergence and a daily divergence describe different spans of price history.
The detail screen identifies Bullish RSI Divergence or Bearish RSI Divergence, its timeframe, market context and displayed evidence. Use the RSI value and pivot-related evidence alongside the chart, rather than reading one number in isolation.
The candle-close time describes the analysed interval. The alert-received time describes delivery; it need not equal the pivot time or a tradable entry time. CoinScreener alerts identify market conditions. A divergence alert does not include the complete strategy trade plan supplied by a Polaris Signal.
Past fires shows earlier occurrences of the alert. Check how long each response is measured after the event. A gain over the following candles does not show that you could have entered at the alert price or held through the entire move.
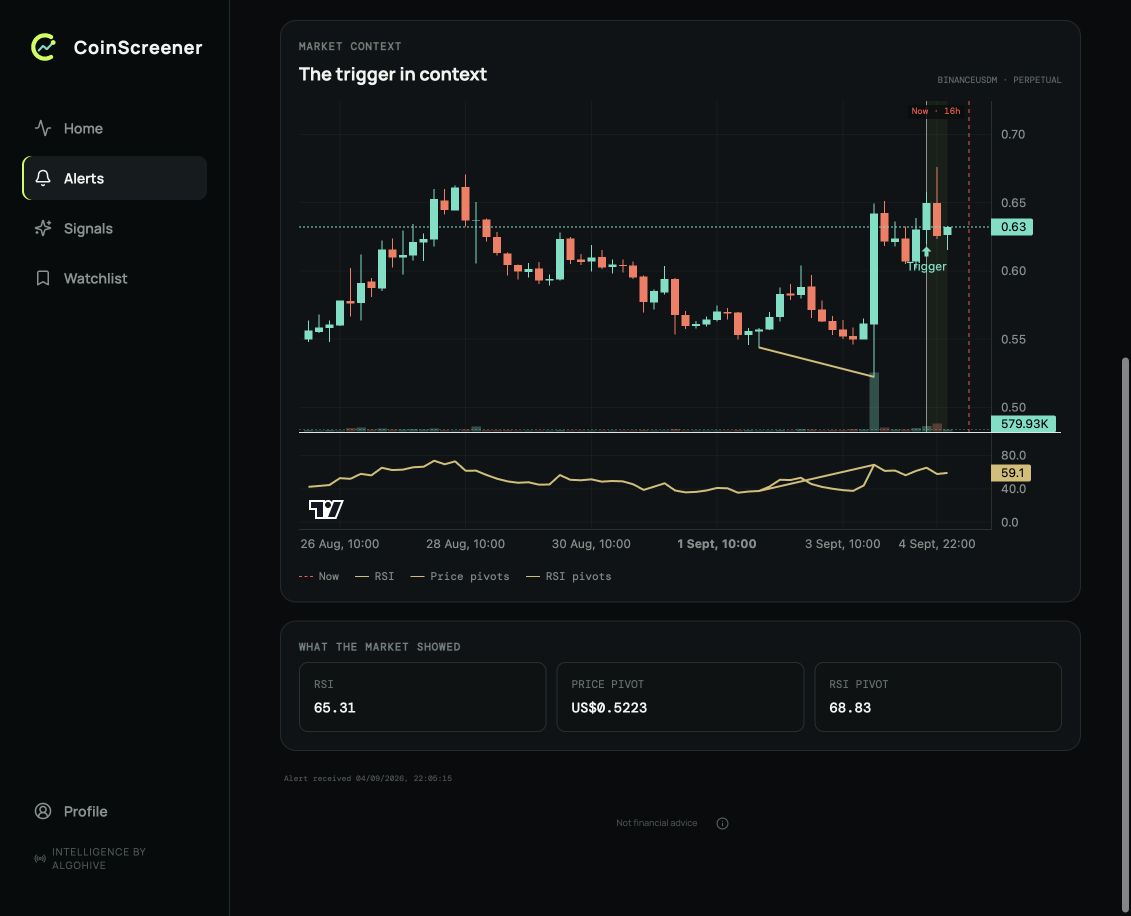
Follow the two marked price pivots down to the matching RSI pivots. The connecting lines show the disagreement. The alert evidence and the latest reading at the chart edge refer to different moments.
Three checks
- Read the location. Identify the trend and nearby support or resistance before focusing on the RSI lines. Check whether the market is liquid enough for the trade you are considering.
- Verify the two swings. Match price and RSI at the same timestamps. Confirm that the second swing has become identifiable; the latest forming candle can still change.
- Plan the exit. Consider nearby structure and how you would respond if price stalls or breaks the invalidation. Do not widen a stop solely to keep a divergence story alive.
Explore examples
Explore the chart lesson
Play the lesson or use Next to inspect each stage. The prices are hypothetical, and the 14-period RSI is calculated from those prices. Watch when the second swing marker becomes visible: later candles help identify the turn. At the low or high itself, you could not yet know it would become a pivot.
Momentum follows price
Only the candles revealed so far are available. We do not yet know where the next swing will end.
Illustrated walkthrough · all scenarios
Bullish
- Momentum follows price. Only the candles revealed so far are available. We do not yet know where the next swing will end.
- First swing is visible. Price has bounced from its first low. Match that swing to RSI at the same point in time.
- A possible divergence. The second extreme is forming. A new low or high is not yet a confirmed pivot: another candle can extend the move.
- Price and momentum disagree. Price made a lower low; RSI made a higher low. Later candles now help identify the second swing. This warns of weakening downward momentum.
- Observe what happened next. Price follows through in this hypothetical case. That outcome was not known at the divergence. Compare the failed example before treating the pattern as an entry.
Bearish
- Momentum follows price. Only the candles revealed so far are available. We do not yet know where the next swing will end.
- First swing is visible. Price has pulled back from its first high. Match that swing to RSI at the same point in time.
- A possible divergence. The second extreme is forming. A new low or high is not yet a confirmed pivot: another candle can extend the move.
- Price and momentum disagree. Price made a higher high; RSI made a lower high. Later candles now help identify the second swing. This warns of weakening upward momentum.
- Observe what happened next. Price follows through in this hypothetical case. That outcome was not known at the divergence. Compare the failed example before treating the pattern as an entry.
Failed bullish
- Momentum follows price. Only the candles revealed so far are available. We do not yet know where the next swing will end.
- First swing is visible. Price has bounced from its first low. Match that swing to RSI at the same point in time.
- A possible divergence. The second extreme is forming. A new low or high is not yet a confirmed pivot: another candle can extend the move.
- Price and momentum disagree. Price made a lower low; RSI made a higher low. Later candles now help identify the second swing. This warns of weakening downward momentum.
- The warning did not become a reversal. Price breaks below the second low. Divergence can fail. A possible setup needs an invalidation level and a decision to exit or stay out.
The successful example and the failed bullish example begin with the same divergence. The difference appears afterward. That distinction is the reason a trading plan needs an invalidation level.
Still moving higher
Gradually slowing down
Sources
Product behavior checked against V3 source on 9 September 2026. Screenshots retain their original capture dates.