What it means
A moving average smooths price changes into a line. A simple moving average (SMA) adds the closing prices of a set number of candles and divides by that number. For example, a 50-candle SMA uses the latest 50 closes, with equal weight for each.
CoinScreener's Golden Cross alert occurs when the 50-candle SMA moves above the 200-candle SMA at a candle close, after sitting at or below it for each of the previous three candles. The alert uses the four-hour chart.
CoinScreener's Death Cross is the reverse: the 50-candle SMA moves below the 200-candle SMA at a candle close, after sitting at or above it for each of the previous three candles.
An exponential moving average (EMA) gives recent closes more weight than older ones. Unlike an SMA, it keeps a diminishing influence from prices older than its named period. Traders use the 200-period EMA as one reference for the longer trend.
CoinScreener's 200 EMA Breakdown occurs when price closes below this line after closing at or above it for each of the previous three candles. Price can recover above the line soon afterwards. Check whether later candles remain below it or recover above it.
Because averages use past prices, a cross appears after the price changes that caused it. This delay is called lag. It can help you see a change in trend, but it cannot establish whether that trend will continue.
In CoinScreener
CoinScreener supports Death Cross and 200 EMA Breakdown on 4h and 1D, and Golden Cross on 4h only. Here, 4h means one candle every four hours and 1D means one candle per day. Start with the alert's timeframe, then check a broader chart for context.
Open Alerts, select the alert type and choose a supported timeframe. Open a matching alert and read its evidence:
- Golden Cross / Death Cross: the 50- and 200-candle SMA values, plus their percentage gap relative to the 200-candle SMA. For example, 101 versus 100 gives a +1% gap.
- 200 EMA Breakdown: the candle close, the 200 EMA and the close's percentage distance from the EMA. A close of 99 against an EMA of 100 gives −1%.
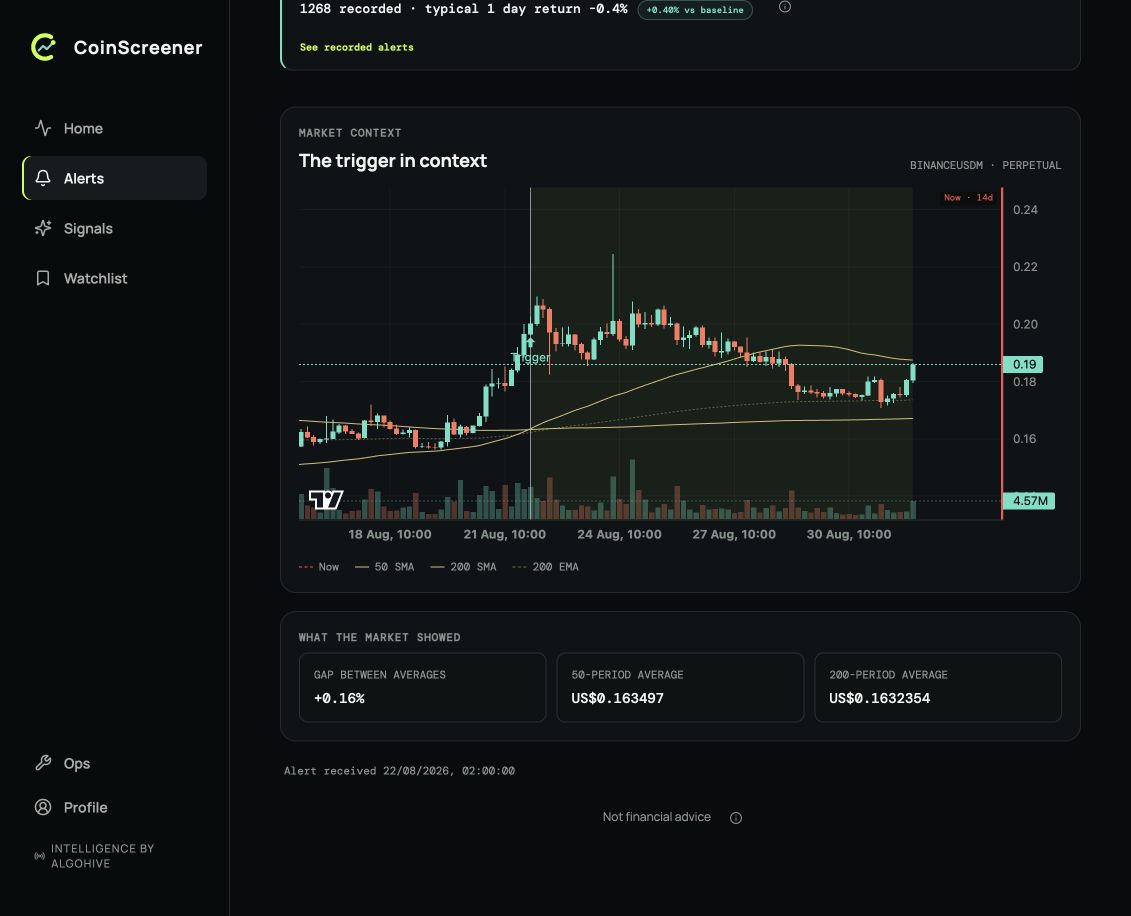
A recorded SYRUPUSDT four-hour Golden Cross. Follow the vertical trigger line down to the two solid SMA lines: the 50 SMA has just crossed above the 200 SMA. The evidence cards show a +0.16% gap. The dashed 200 EMA is a separate reference. This is a historical replay example, not a live notification.
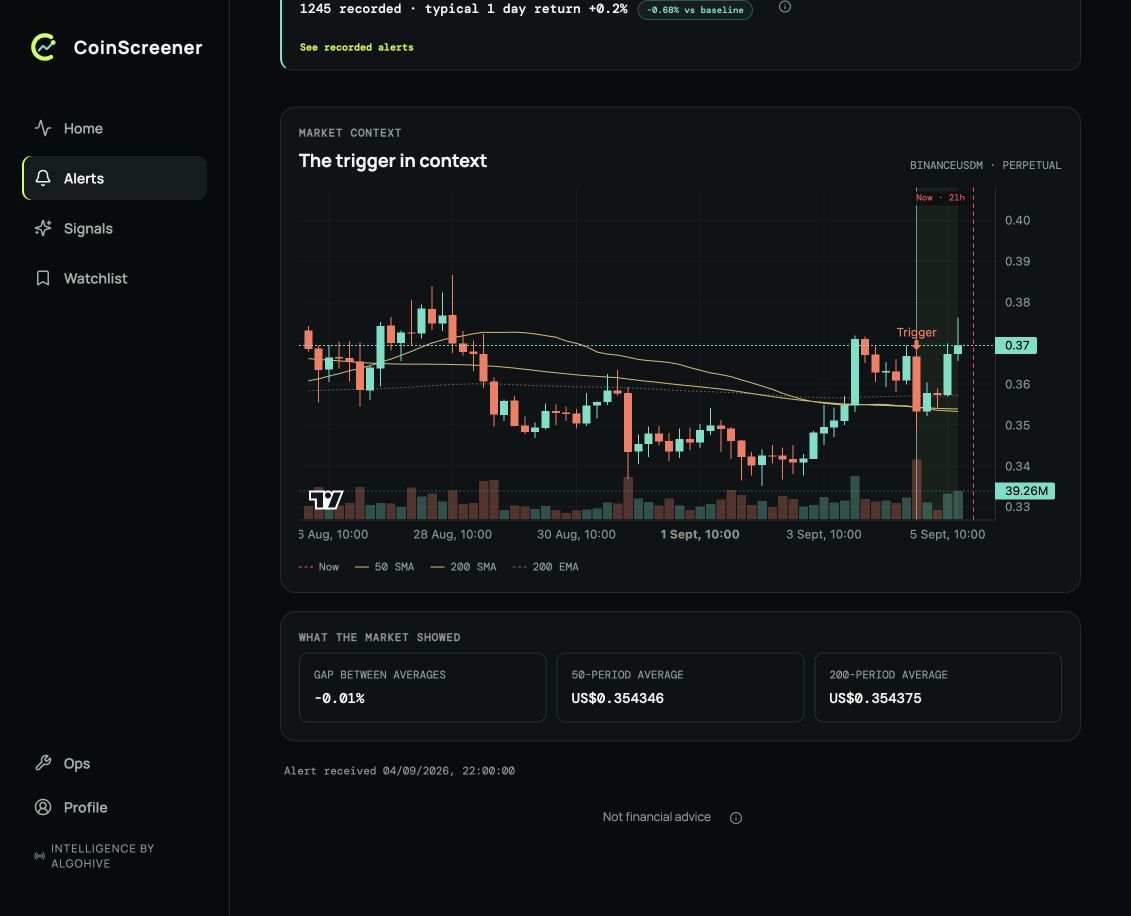
A recorded ONDOUSDT four-hour Death Cross. The 50-period SMA is 0.354346, just below the 200-period SMA at 0.354375; the displayed gap rounds to -0.01%. At the vertical trigger line, the two solid SMA lines have just changed order. The dashed EMA is not part of this cross. This is a historical replay example, not a live notification.
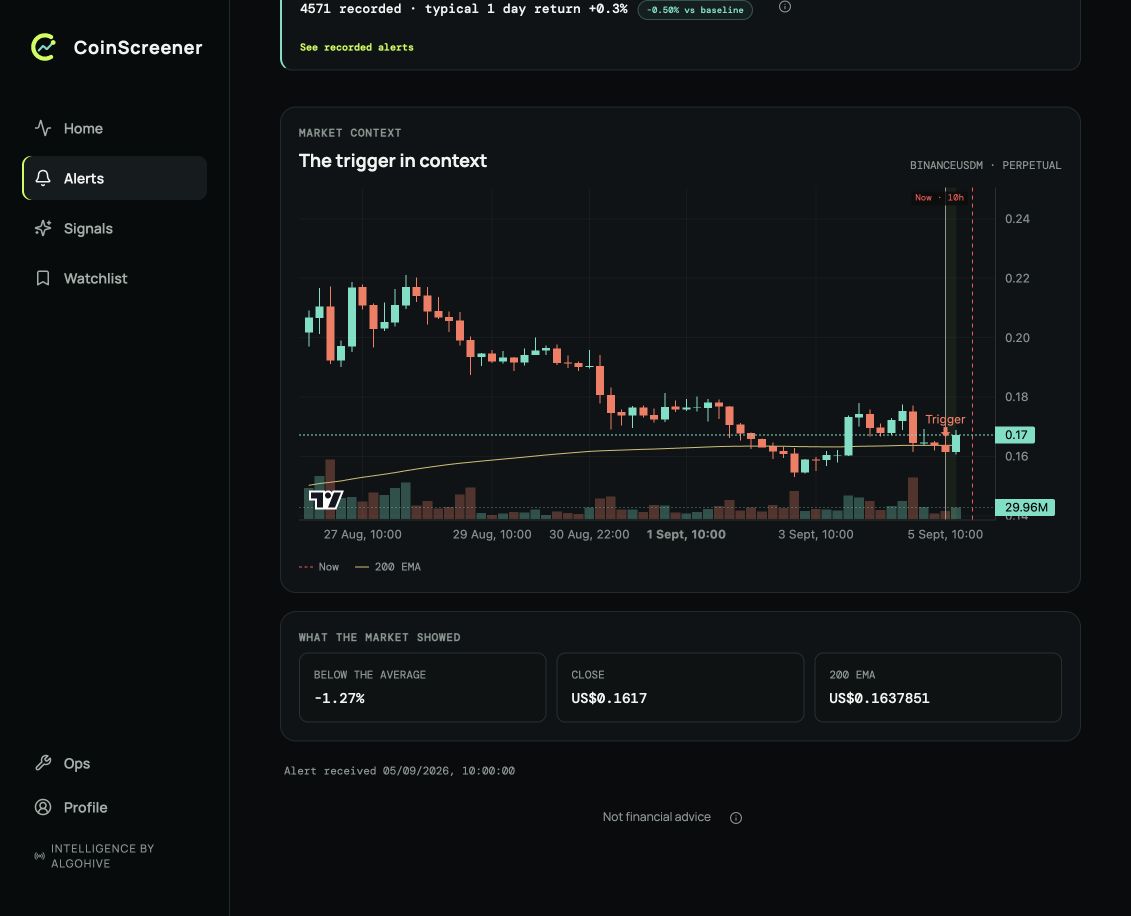
A recorded FARTCOINUSDT four-hour 200 EMA Breakdown. Compare the marked candle with the EMA line, then read the evidence: close 0.1617, 200 EMA 0.1637851 and a -1.27% gap. The chart and evidence describe a historical event, not a live notification.
Three checks
- Identify the event. Check the alert type, market and timeframe. Use the matching SMA or EMA on the chart.
- Check the available price. Compare today's price with the alert candle and the averages. Delivery time is not an entry price.
- Plan for failure. Decide what would invalidate your idea and how you would exit. CoinScreener's alert does not supply a stop.
Explore examples
Explore the chart lesson
Select each scenario, then step through the candles. The lime line is a 5-candle SMA and the aqua line is a 12-candle SMA. These shorter periods keep the example readable; CoinScreener uses 50 and 200. The lesson illustrates SMA crosses, not the separate EMA breakdown.
Two averages of the same prices
The lime line is a 5-candle simple moving average; the aqua line is a 12-candle one. Compare their positions before price changes direction. CoinScreener uses 50 and 200 candles; this lesson uses shorter periods so the chart fits.
Illustrated walkthrough · all scenarios
Golden cross
- Two averages of the same prices. The lime line is a 5-candle simple moving average; the aqua line is a 12-candle one. Compare their positions before price changes direction. CoinScreener uses 50 and 200 candles; this lesson uses shorter periods so the chart fits.
- Price turns up first. Price has started rising from its recent low. The averages still reflect the earlier decline, so the fast line remains below the slow one. A cross has not happened yet.
- The golden cross. The fast average is now above the slow one. Price started rising several candles earlier. The cross records the change in the averages; it cannot tell us whether the rise will continue.
- The trend continues here. The averages keep separating in this hypothetical case. That outcome was not known at the cross. Compare the failed example before treating a cross as an entry on its own.
Death cross
- Two averages of the same prices. The lime line is a 5-candle simple moving average; the aqua line is a 12-candle one. Compare their positions before price changes direction. CoinScreener uses 50 and 200 candles; this lesson uses shorter periods so the chart fits.
- Price turns down first. Price has started falling from its recent high. The averages still reflect the earlier rise, so the fast line remains above the slow one. A cross has not happened yet.
- The death cross. The fast average is now below the slow one. Price started falling several candles earlier. The cross records the change in the averages; it cannot tell us whether the decline will continue.
- The trend continues here. The averages keep separating in this hypothetical case. That outcome was not known at the cross. Compare the failed example before treating a cross as an entry on its own.
Cross that fails
- Two averages of the same prices. The lime line is a 5-candle simple moving average; the aqua line is a 12-candle one. Compare their positions before price changes direction. CoinScreener uses 50 and 200 candles; this lesson uses shorter periods so the chart fits.
- Price turns up first. Price has started rising from its recent low. The averages still reflect the earlier decline, so the fast line remains below the slow one. A cross has not happened yet.
- The golden cross. The fast average is now above the slow one. Price started rising several candles earlier. The cross records the change in the averages; it cannot tell us whether the rise will continue.
- The cross reverses. Price falls and the fast average crosses back below the slow one. This reversal is called a whipsaw. The first cross did not lead to a lasting rise; compare it with the exit condition in your plan.
In Cross that fails, the fast average crosses above the slow one and later crosses back below it. This reversal is called a whipsaw. Compare it with the continuing examples: the cross alone cannot tell you which outcome will follow.
Sources
Product behavior checked against V3 source on 9 September 2026. Screenshots retain their original capture dates.