What it means
A backtest applies a strategy to historical data and records simulated trades or portfolio results. Its usefulness depends on the strategy version, data, instruments, date range, execution assumptions and measurement method.
It helps answer, “How would this strategy have behaved in that period, under these assumptions?” It cannot tell you what next month will bring. If many strategies were tried and only the best result was selected, some apparent success may come from fitting that particular history too closely.
Total return compares ending equity with starting equity, assuming a consistent treatment of cash flows and costs. In the full lesson, 100 becomes 120: a 20% total return.
Drawdown measures a decline from an earlier equity peak. The same curve rises to 112 and then falls to 90. That decline is (112 − 90) ÷ 112 ≈ 19.6%, even though the ending result is positive. Maximum drawdown is the largest such decline in the observed series.
A handful of winning trades provides limited evidence. A larger sample can be more informative, but most trades might come from the same strong rally or quiet trading range. Hundreds of trades in similar conditions still leave other market conditions untested.
In CoinScreener
Open a strategy's Performance view and inspect the published backtest, the trades it covers and its assumptions. Review any live statistics separately. Use the current labels, dates and version when assessing a result.
Win rate is the percentage of measured trades that were winners, according to the stated definition. It does not tell you how large the wins were. For example, eight gains of 1 and two losses of 5 give an 80% win rate but a net loss of 2 before costs.
Read average outcomes, payoff distribution and costs where available. Fees, spreads, slippage and holding costs can change the result. A simulation with optimistic execution assumptions may overstate what was executable.
Historical results simulate a strategy over past data. Live results follow it after it begins operating. Live does not necessarily mean exchange-executed: a live strategy record can track reference trades without placing orders in your account. Check how entries, exits and costs are measured before treating either record as an achievable account return.
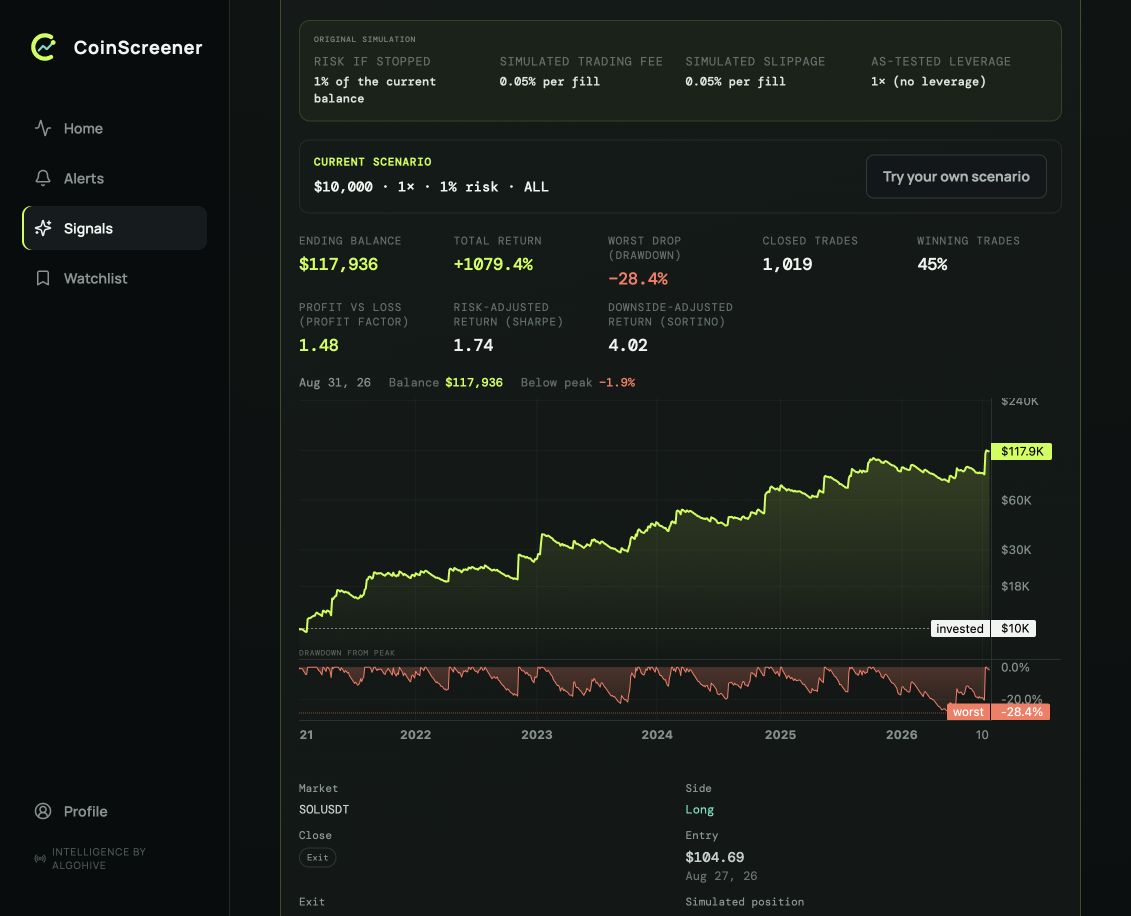
Start with the original simulation assumptions, then compare the equity curve with drawdown beneath it. These are Polaris Gold historical simulation results, not an account statement, current live results or a forecast.
Three checks
- Identify the published strategy and version.
- Read dates, markets and sample size before headline performance.
- Review the trade list and per-market results where available.
Explore examples
Explore the chart lesson
The lesson begins with 100 hypothetical units and no deposits or withdrawals. Compare the short sample with the complete example, which includes a substantial drawdown before recovery.
An equity curve plots the value of a simulated or live portfolio through time. Check whether its value includes open-position gains and losses or only closed trades; the choice changes what the curve can show.
A new high
Equity has risen from 100 to 112. Total return is 12% so far; that does not describe the path still ahead.
Illustrated walkthrough · all scenarios
Full example
- A new high. Equity has risen from 100 to 112. Total return is 12% so far; that does not describe the path still ahead.
- Drawdown. Equity falls from a peak of 112 to 90: a 19.6% drawdown. Drawdown is measured from the running peak, not the initial account value.
- Recovery takes time. Equity reaches 113 and finally exceeds the earlier peak. A profitable endpoint can conceal a difficult recovery.
- Read the whole record. The example ends at 120: a 20% total return alongside a 19.6% maximum drawdown. These hypothetical observations show the whole path, not just the profitable endpoint.
Short sample
- A small window. Equity starts at 100 hypothetical units, with no deposits or withdrawals.
- A promising start. This short stretch looks promising, but it has not shown how the portfolio behaves through a substantial decline or a long recovery.
- The short sample ends. The gain is 12%. This window contains no major downturn. Switch to the full example to see what the short window missed.
This is a teaching curve, not a Polaris result. Its observations are not trades or calendar years. Do not annualise it or infer trade statistics that the example does not contain.
Sources
Product behavior checked against V3 source on 9 September 2026. Screenshots retain their original capture dates.