
What it means
Volatility describes how much prices move. Sometimes candles cluster in a tight range, swings shorten and the distance between volatility bands narrows. This period of reduced movement is often called a squeeze. Think of it as the market becoming quieter; quiet alone cannot tell you what happens next.
Bollinger Bands and Keltner Channels are pairs of lines drawn around price. Bollinger Bands widen as closing prices spread farther from their average. Keltner Channels use a measure of trading ranges, including gaps. Comparing their widths helps describe compression; you can see both on CoinScreener's chart.
The market can remain compressed for a long time. A squeeze does not say when the range will break, which direction it will break, or whether the first break will persist.
CoinScreener calls this state Volatility Squeeze. Compression is active: the Bollinger envelope is narrower than the Keltner envelope. Treat it as a prompt to prepare and inspect the surrounding range.
Squeeze Release describes a transition out of compression. The market was squeezed and is no longer in that state. That is a change in volatility, not confirmation that an upward or downward trade will succeed.
Volatility Expansion describes a sharper widening of movement. It distinguishes acceleration from simply leaving compression. Expansion can happen around a release, but it can also occur without a fresh squeeze first.
In CoinScreener
CoinScreener supports Volatility Squeeze, Squeeze Release and Volatility Expansion on 1h, 4h and 1D. Inspect the alerted interval first and then a broader chart. Select a decision horizon you can monitor, rather than repeatedly changing the chart to find the most dramatic-looking break.
Start with the label: Volatility Squeeze, Squeeze Release or Volatility Expansion. The width readings describe how far apart the band or channel lines are, while width change describes how that measure changed over the comparison interval. Read any momentum value alongside price to understand direction.
Use the market-context chart to compare the bands with actual candles. Check the close time and the price available after delivery. The alert's historical responses are a separate measurement from a full strategy backtest with entries, stops and costs.
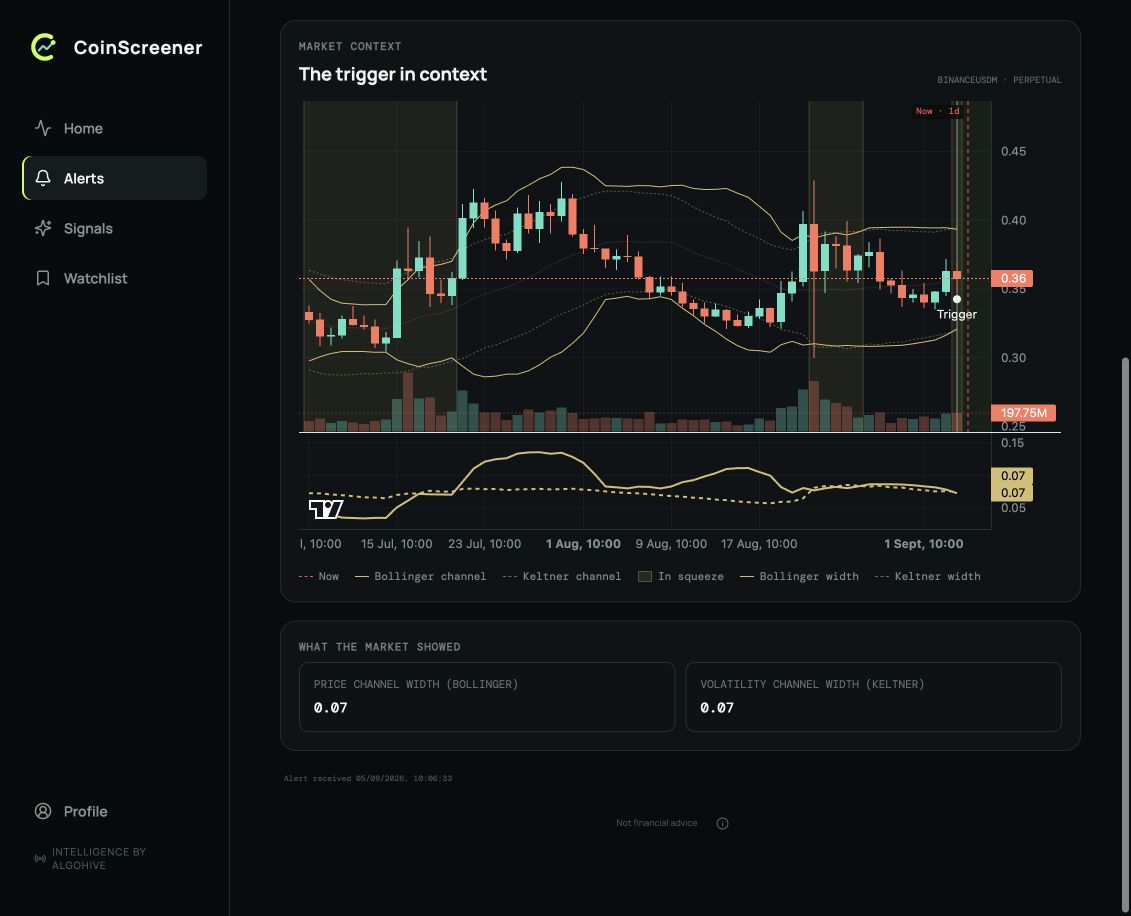
Use the legend to distinguish Bollinger and Keltner channels, the shaded squeeze periods and the width panel below price. This screenshot shows compression; it does not establish the next breakout direction.
Three checks
- Map the range. Mark where price has repeatedly stopped advancing or declining and note nearby higher-timeframe obstacles.
- Identify the actual alert. Preparation during compression is different from assessing a move after release or expansion.
- Compare risk and potential reward. Decide what would invalidate the break, compare the entry-to-stop distance with the room to the next obstacle, and include costs.
Explore examples
Explore the chart lesson
Compare an upward break, a downward break, a false breakout and expansion from an already active market. The bands are calculated from the hypothetical candles. Watch both the changing widths and whether price holds outside the old range.
A narrow range
Candles cluster in a narrow range. The lime Bollinger envelope sits inside the dashed aqua range-based channel; direction remains unknown.
Illustrated walkthrough · all scenarios
Break up
- A narrow range. Candles cluster in a narrow range. The lime Bollinger envelope sits inside the dashed aqua range-based channel; direction remains unknown.
- The range starts to widen. A larger candle changes the picture. A release of compression still needs directional price evidence; a volatility observation is not a buy or sell instruction.
- Watch the follow-through. The band and channel widths respond to the changing price movement. Compare that widening with the candles: has price stayed outside the old range? The lesson uses simplified educational bands.
- Movement has expanded. The move continued in this example. Expansion describes increased movement; it does not establish whether entering now offers acceptable risk.
Break down
- A narrow range. Candles cluster in a narrow range. The lime Bollinger envelope sits inside the dashed aqua range-based channel; direction remains unknown.
- The range starts to widen. A larger candle changes the picture. A release of compression still needs directional price evidence; a volatility observation is not a buy or sell instruction.
- Watch the follow-through. The band and channel widths respond to the changing price movement. Compare that widening with the candles: has price stayed outside the old range? The lesson uses simplified educational bands.
- Movement has expanded. The move continued in this example. Expansion describes increased movement; it does not establish whether entering now offers acceptable risk.
False breakout
- A narrow range. Candles cluster in a narrow range. The lime Bollinger envelope sits inside the dashed aqua range-based channel; direction remains unknown.
- The range starts to widen. A larger candle changes the picture. A release of compression still needs directional price evidence; a volatility observation is not a buy or sell instruction.
- Watch the follow-through. The band and channel widths respond to the changing price movement. Compare that widening with the candles: has price stayed outside the old range? The lesson uses simplified educational bands.
- Back inside the range. Price returns to the old range. The first breakout has failed to hold. Check this against the exit condition you decided on before considering the trade.
Expansion alone
- Already moving. This example starts with wider price movement. Expansion does not require a fresh squeeze first.
- The range starts to widen. A larger candle appears without a preceding squeeze. Expansion describes wider price movement; it does not establish a direction to trade or an acceptable entry.
- Watch the follow-through. The band and channel widths respond to the changing price movement. Compare that widening with the candles: has price stayed outside the old range? The lesson uses simplified educational bands.
- Movement has expanded. The move continued in this example. Expansion describes increased movement; it does not establish whether entering now offers acceptable risk.
The three alert labels are not a required sequence. A squeeze can persist, a release can fail, and expansion can arrive independently. Do not invent a missing stage when reading an alert.
Sources
Product behavior checked against V3 source on 9 September 2026. Screenshots retain their original capture dates.


