What it means
An alert describes something observed in the market: unusual activity, an RSI condition, divergence, a change in volatility, a moving-average cross or a range breakout. It helps you decide where to look. It is not a complete trading plan.
CoinScreener has 19 alert types. The Market Alerts guides explain volume, open interest, RSI, divergence, volatility, moving averages, range breaks and reversal patterns.
A Signal comes from a published strategy and presents a trade setup. This library covers Polaris Gold, Polaris Blue and Polaris Meme. Their guides explain market coverage, the displayed setup and how to review the results.
The strategy name identifies the source of the idea. The side tells you whether it is long (benefits from rising prices) or short (benefits from falling prices). Read the entry, stop and any published target together, then compare the reference entry with the price available now.
- Entry: the strategy's reference price for opening the position.
- Invalidation: the price event that would make the trade idea no longer hold.
- Stop: a planned exit intended to limit loss. A stop order is one way to act on the plan.
- Target, when provided: a planned price for taking profit.
Some Signals have no published fixed target. In that case, a target-based reward-to-risk ratio is unavailable; do not assume a line elsewhere on the chart supplies the missing level. A fill is the price at which an order actually executes.
Insights help you understand the wider market. Coin Rotation shows which coin groups are getting busier. Positioning explains the cost of keeping futures trades open. Market Breadth shows how many coins join a move. Market Relationships compares coins with Bitcoin or Ether. Always check the date of the data.
In CoinScreener
Start in Alerts and choose a market condition and supported timeframe. Open a card to inspect the chart and the evidence at the trigger. In Signals, read the strategy, direction and reference levels, then open Performance to review historical evidence separately from live results.
Save markets to your Watchlist to find matching activity, and manage notification preferences in Profile. Five-minute alerts are scoped to your watchlist. A notification draws your attention to an event; it does not place an order. Recheck the available price when you open it.
A candle timestamp identifies an interval in the chart; a candle-close label tells you when it finished. Trigger time tells you when the condition or setup was recorded. Received time tells you when it was delivered. For example, an alert about a candle that closed at 12:00 may reach you later, after price has moved again.
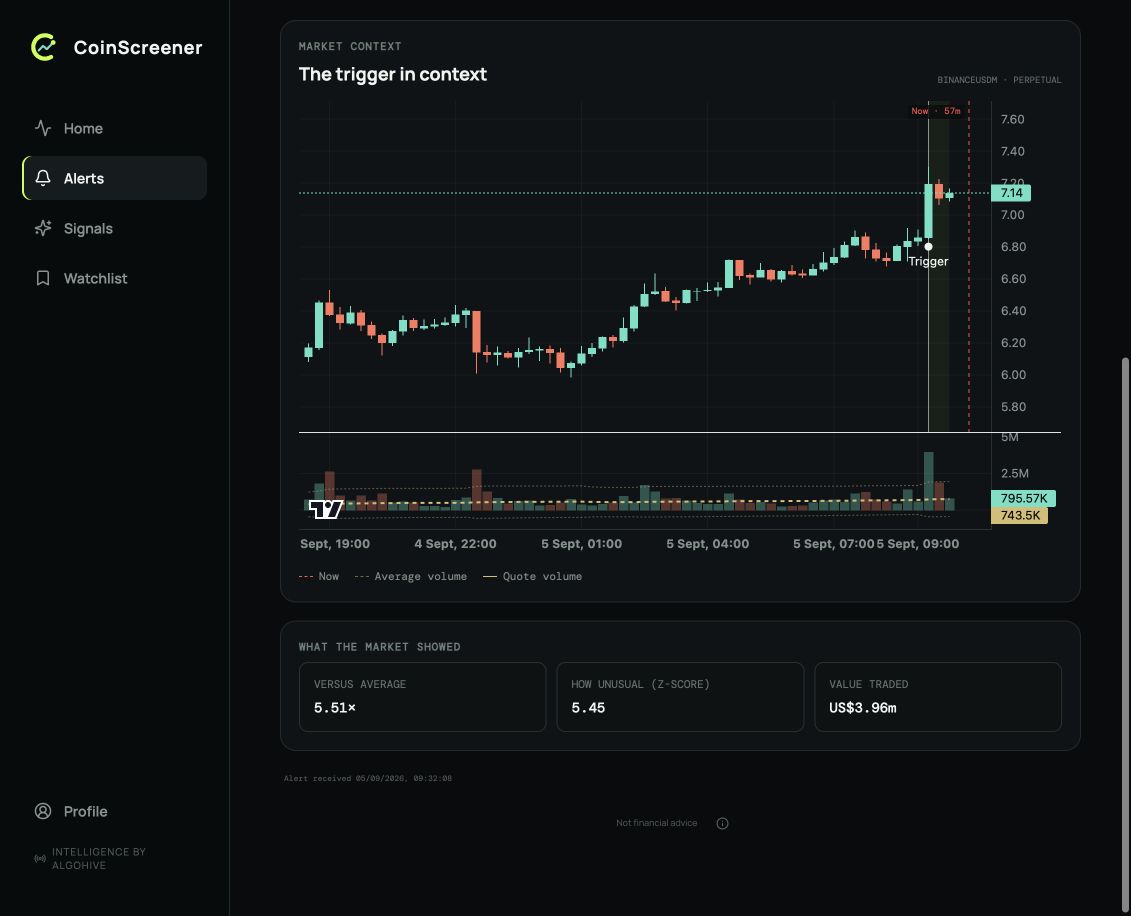
An alert screen explains a market observation through its chart and evidence cards. It does not supply a complete entry, stop and exit plan.
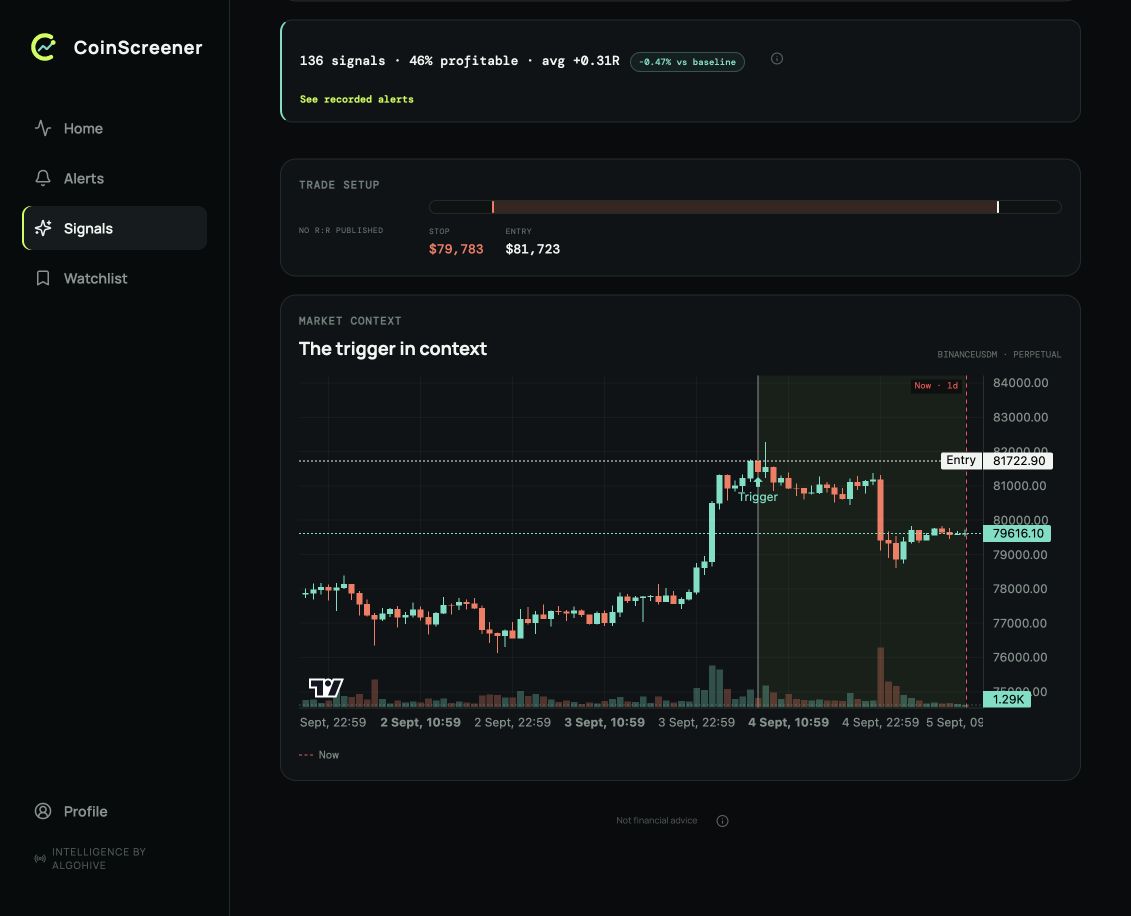
A Signal includes the reference trade setup. This example shows an entry and stop, with no fixed target or reward-to-risk published. Read the actual fields provided and distinguish the strategy’s levels from your own fills.
Three checks
- Verify the market, venue, direction and relevant time information.
- Read the evidence and chart before looking at a headline historical statistic.
- Define invalidation, costs, size and total exposure before any trade.
Explore examples
Explore the chart lesson
The lesson uses an invented setup with entry 100, a stop two price units away and a target four units away. Compare a long, a short, a stopped trade and an entry that arrives late.
Before the setup
This hypothetical example will introduce an entry, stop and target. Watch when the levels become available, then compare the different outcomes. It is not a Polaris Signal.
Illustrated walkthrough · all scenarios
Long setup
- Before the setup. This hypothetical example will introduce an entry, stop and target. Watch when the levels become available, then compare the different outcomes. It is not a Polaris Signal.
- A hypothetical trade plan. The original idea has entry 100, stop two price units away and target four units away: 2:1 reward-to-risk before costs. A stop is an intended exit, not a guaranteed fill.
- Manage the risk you planned. An open trade's gain or loss is not a closed result. Review actual fills and total exposure; the chart cannot decide an appropriate size for your account.
- The target is crossed. The candle reaches the hypothetical target. The line crossing alone is not proof of your fill. Verify the trade status, execution and costs.
Short setup
- Before the setup. This hypothetical example will introduce an entry, stop and target. Watch when the levels become available, then compare the different outcomes. It is not a Polaris Signal.
- A hypothetical trade plan. The original idea has entry 100, stop two price units away and target four units away: 2:1 reward-to-risk before costs. A stop is an intended exit, not a guaranteed fill.
- Manage the risk you planned. An open trade's gain or loss is not a closed result. Review actual fills and total exposure; the chart cannot decide an appropriate size for your account.
- The target is crossed. The candle reaches the hypothetical target. The line crossing alone is not proof of your fill. Verify the trade status, execution and costs.
Stopped out
- Before the setup. This hypothetical example will introduce an entry, stop and target. Watch when the levels become available, then compare the different outcomes. It is not a Polaris Signal.
- A hypothetical trade plan. The original idea has entry 100, stop two price units away and target four units away: 2:1 reward-to-risk before costs. A stop is an intended exit, not a guaranteed fill.
- Manage the risk you planned. An open trade's gain or loss is not a closed result. Review actual fills and total exposure; the chart cannot decide an appropriate size for your account.
- The stop is crossed. The candle trades through 98. Real execution can be worse than the stop price because of gaps, slippage or liquidity. A losing outcome must fit the risk budget.
Late entry
- Before the setup. This hypothetical example will introduce an entry, stop and target. Watch when the levels become available, then compare the different outcomes. It is not a Polaris Signal.
- A hypothetical trade plan. The original idea has entry 100, stop two price units away and target four units away: 2:1 reward-to-risk before costs. A stop is an intended exit, not a guaranteed fill.
- The price has already moved. Entering at 102 with the original stop at 98 and target at 104 risks 4 to seek 2: only 0.5:1 before costs. The old reward-to-risk no longer describes this entry.
- The target is crossed. The candle reaches the hypothetical target. The line crossing alone is not proof of your fill. Verify the trade status, execution and costs.
For a long, price gains help the position; the stop is below entry and the target above. For a short, the directions reverse. The lesson does not reproduce a Polaris strategy and is not an instruction to trade these prices.
Sources
Product behavior checked against V3 source on 9 September 2026. Screenshots retain their original capture dates.