What is RSI?

The Relative Strength Index (RSI) compares the size of upward and downward closing-price changes on a scale from 0 to 100. Think of it as a way to describe the balance of recent gains and losses. The lesson uses the common 14-period version with Wilder's smoothing, which carries some influence from older price changes into each new reading.

A period is a chart interval. Fourteen one-hour candles and fourteen daily candles describe very different spans. RSI is also different from comparing one asset's performance with another: its name refers here to the balance of gains and losses within the same price series.

Overbought

Conventionally, RSI above 70 is described as overbought. Recent upward changes have been strong relative to downward changes. This does not establish that the asset is fundamentally overvalued or that it must fall next.

In a persistent uptrend, RSI can stay elevated while price continues rising. A trader who shorts every high reading may repeatedly fight that trend. Use the reading to ask how far price has already travelled and whether a new entry leaves enough room before nearby resistance.

Oversold

Conventionally, RSI below 30 is described as oversold. Recent downward changes have been strong relative to upward changes. The asset is not necessarily cheap, and buyers have not necessarily regained control.

A falling market can remain oversold. Buying simply because RSI crossed a conventional level can leave a position exposed to further decline. Look for price evidence that matches a defined plan, such as support holding or a level being reclaimed, and decide what would invalidate that idea.

Watch an extreme persist

Switch between the rising and falling scenarios. In both, the RSI extreme lasts while the price trend continues. These examples deliberately challenge the idea that an extreme must immediately reverse.

Watch the market unfoldHypothetical example
Overbought persists: candlestick chart, 16 of 36 observationsSynthetic educational data. Aligned 14-period RSI below price. Only revealed observations are plotted. Full explanations follow the chart.140125110PRICE · HYPOTHETICAL UNITSRSI (14)030701001Candle 16 / 36
Close 112.60RSI 53.6
01 / 04

Begin with the context

RSI compares upward and downward closing-price changes. The lower panel calculates a 14-period RSI from the hypothetical prices above.

Illustrated walkthrough · all scenarios

Overbought persists

Overbought persists: candlestick chart, 36 of 36 observationsSynthetic educational data. Aligned 14-period RSI below price. Only revealed observations are plotted. Full explanations follow the chart.140125110PRICE · HYPOTHETICAL UNITSRSI (14)030701001Candle 36 / 36
Close 138.70RSI 90.2
  1. Begin with the context. RSI compares upward and downward closing-price changes. The lower panel calculates a 14-period RSI from the hypothetical prices above.
  2. Momentum reaches an extreme. RSI moves above 70. Strong recent buying is visible, but sellers have not necessarily taken control.
  3. The trend continues. Price keeps moving in the same direction while RSI stays extreme. Taking the opposite side just because of RSI would be trading against this continuing trend.
  4. Wait for price evidence. The trend has continued through the extreme reading. Check nearby price levels, what would make your idea fail, and the cost of entering before deciding to trade.

Oversold persists

Oversold persists: candlestick chart, 36 of 36 observationsSynthetic educational data. Aligned 14-period RSI below price. Only revealed observations are plotted. Full explanations follow the chart.1109580PRICE · HYPOTHETICAL UNITSRSI (14)030701001Candle 36 / 36
Close 81.30RSI 9.8
  1. Begin with the context. RSI compares upward and downward closing-price changes. The lower panel calculates a 14-period RSI from the hypothetical prices above.
  2. Momentum reaches an extreme. RSI moves below 30. Strong recent selling is visible, but buyers have not necessarily taken control.
  3. The trend continues. Price keeps moving in the same direction while RSI stays extreme. Taking the opposite side just because of RSI would be trading against this continuing trend.
  4. Wait for price evidence. The trend has continued through the extreme reading. Check nearby price levels, what would make your idea fail, and the cost of entering before deciding to trade.

The 30 and 70 lines mark conventional reference levels. An RSI of 75 does not mean a 75% chance of a fall. Read the value as momentum context and the alert label as the condition CoinScreener observed.

What it shows about the market

RSI offers another view of the balance of recent price changes. It can help describe strong momentum, stretched conditions or a change in that balance. It does not measure valuation, liquidity, transaction costs or how much risk a trader should take.

Read it in context. An elevated reading in an orderly trend is different from an elevated reading just beneath repeatedly tested resistance. A low reading during a rapid news-driven sell-off is different from one during a contained trading range. Similar indicator values can describe very different trade opportunities.

Which timeframe should I use?

The general indicator can be calculated on many intervals, and there is no universally best one. Short intervals respond to local movement; longer intervals describe broader price history. More responsive does not automatically mean more useful, especially after execution costs.

CoinScreener provides RSI Overbought and RSI Oversold alerts on 4h, 1D and 1W. An extreme on a four-hour chart can coexist with an ordinary weekly reading. Decide which horizon is relevant rather than treating them as contradictory commands.

How to use it practically

  1. Read the trend first. Is price rising steadily, falling steadily or moving sideways? A high or low RSI can reflect the strength of that trend.
  2. Locate nearby structure. Support and resistance give context to the potential reward and invalidation.
  3. Specify confirmation. If considering a reversal, define a price change you want to observe before entering. RSI moving back through a level is another observation, not a complete risk plan.
  4. Evaluate the current entry. Confirmation may arrive after price has moved significantly. Recalculate the distance to the planned stop and target.
  5. Size and plan the exit. Use an explicit loss budget and allow for imperfect execution. Avoid adding to a losing position simply because RSI is even more extreme.
  6. Accept no trade. A clear momentum condition can still offer no sensible opportunity at the current price.

For example, imagine price falls below 100 with RSI below 30, then closes back above 100. A later pullback that holds above 100 would give a trader more evidence of recovery. Returning below the level would weaken that idea. The numbers illustrate a possible review process, not a buy rule.

When to wait or skip

Wait if the candle is still forming or the price confirmation is absent. Skip if the next obstacle leaves insufficient room, or if a sensible invalidation would exceed the loss budget.

Avoid treating RSI as a countdown, reading every extreme as a reversal, or adjusting the interval until it supports a preferred trade. Also distinguish an extreme from divergence: divergence compares two swings in price and RSI, rather than just one indicator reading.

Reading it in CoinScreener

The detail screen labels the condition as RSI Overbought or RSI Oversold and shows the timeframe, market context, RSI and price-related evidence. Inspect the candle-close time and the current market before deciding what action remains practical.

CoinScreener alerts flag conditions; a strategy Signal supplies reference trade levels. If you review earlier alerts, check how long the app measures price movement afterward. A move after an alert is different from a trade result with a defined entry, exit and costs.
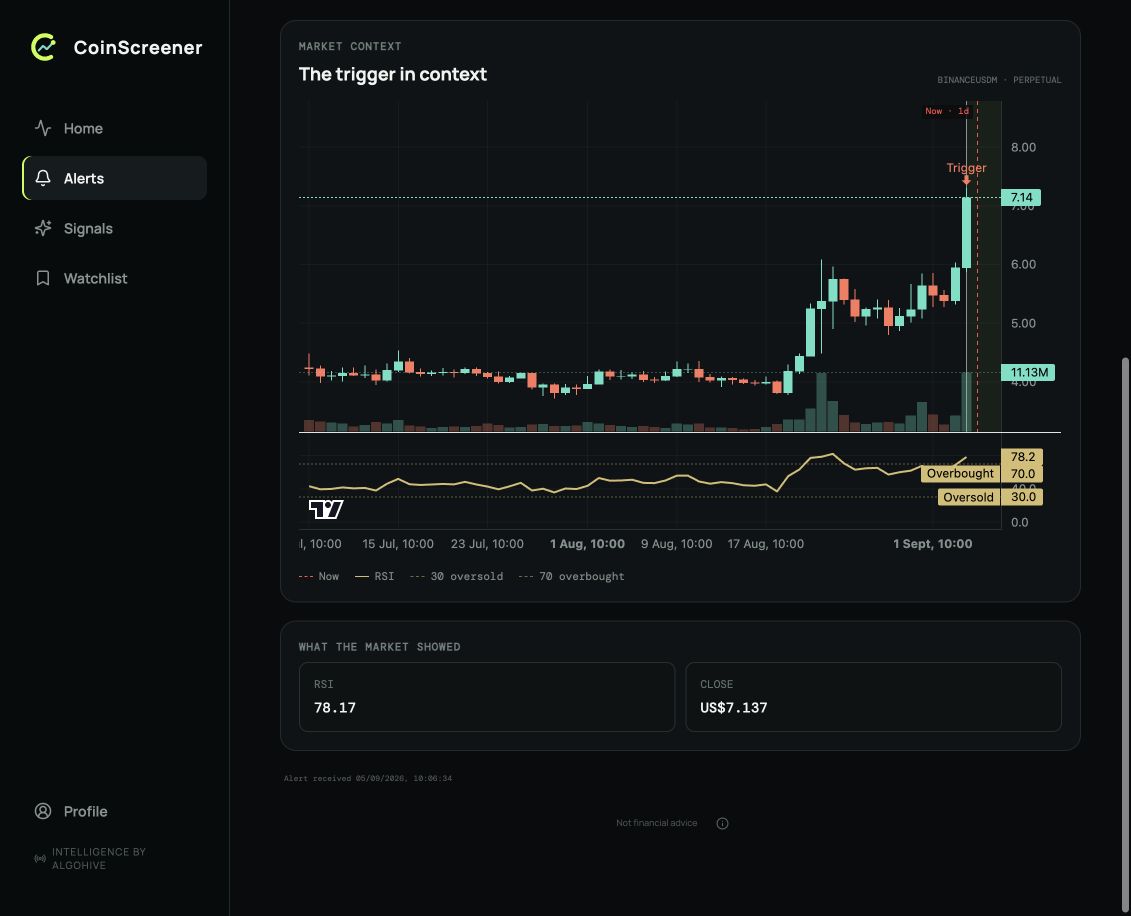
Inside CoinScreenerRSI overbought · ZENUSDT · 1D
CoinScreener web showing daily ZENUSDT candles and an RSI panel with overbought and oversold reference lines, alongside the RSI evidence value.

The lower panel places RSI on the same time axis as price. The 30 and 70 reference lines help orient the reading; an overbought observation alone does not establish that the rising trend has ended.

Web app captured . Figures are a dated snapshot.View full-size
Inside CoinScreener

RSI overbought · ZENUSDT · 1D

CoinScreener web showing daily ZENUSDT candles and an RSI panel with overbought and oversold reference lines, alongside the RSI evidence value.

A quick checklist

  • Read RSI as momentum, not valuation or a guaranteed reversal.
  • Use the alert's actual timeframe and inspect the broader trend.
  • Identify the price evidence needed for the idea.
  • Check current entry, invalidation, reward and costs together.
  • Be willing to wait while the extreme persists.

Common questions

Is RSI above 70 a sell signal? It is conventionally called overbought. Whether to sell, hold or do nothing depends on the position and plan; the reading cannot make that decision alone.

Can RSI stay below 30? Yes. Strong declines can sustain oversold readings. The animated example shows why buying solely from that label can fail.

Does a daily RSI use only the last 14 days? A 14-period daily RSI uses daily closing changes, but Wilder's smoothing also carries information from earlier days. It is not a fresh calculation from only the latest 14 candles.

Sources and further reading

Fidelity: Relative Strength Index describes conventional levels, persistence during trends and divergence. Fidelity's trading with momentum lesson explains how Wilder's smoothing carries earlier values forward. CoinScreener labels and supported intervals were checked on 5 September 2026.