What it means
Market Relationships compares coin price changes with Bitcoin (BTC) or Ether (ETH). The coin you choose as a reference is called the benchmark. All prices are compared over the same period.
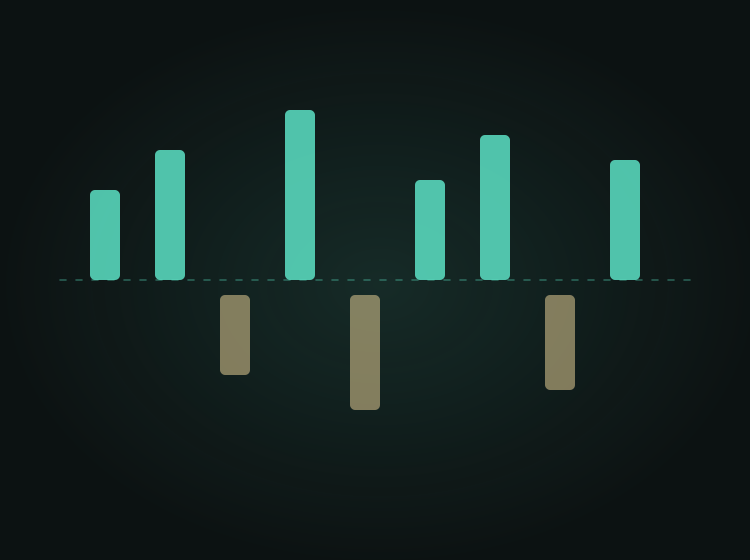
For example, if BTC falls 4% and another coin falls 2%, that coin held up better. It still lost value. Doing better than Bitcoin is not always the same as making a gain.
Changing the reference coin or time period can change the result. Two coins moving together does not prove that one caused the other to move, or that they will keep doing so. Market Breadth helps you see how many coins are taking part in the wider move.
In CoinScreener
Open Insights → Market Relationships. Data updates every four hours (4h) for actively traded Binance perpetual futures: contracts with no expiry date. Free shows older data; Pro shows the latest available update. Check the date and the notice about data access first. The results cover coins with enough data, not the whole crypto market.
In Overview, choose BTC or ETH and a period: four hours, 24 hours or seven days. Read the reference coin's price change, then compare the groups. They show coins moving more, less, in the opposite direction, or about the same. Group names change depending on whether BTC or ETH rose or fell. Grouping uses the displayed changes, rounded to one decimal place. Open a coin for its comparison, or use the list controls to see more coins.
In History, choose times when BTC or ETH rose or fell at least 0.5% in four hours. The app finds matching periods in the past 30 days and shows how other coins moved:
- Typical move: The middle price change when those results are put in order. This is also called the median.
- Finished higher: The percentage of periods in which the coin rose. It does not mean the coin beat BTC or ETH.
These results describe the same four hours, not what happened next. Always check how many matching periods were found. A result based on a few examples can change a lot when one more example is added. Missing history also limits the comparison.
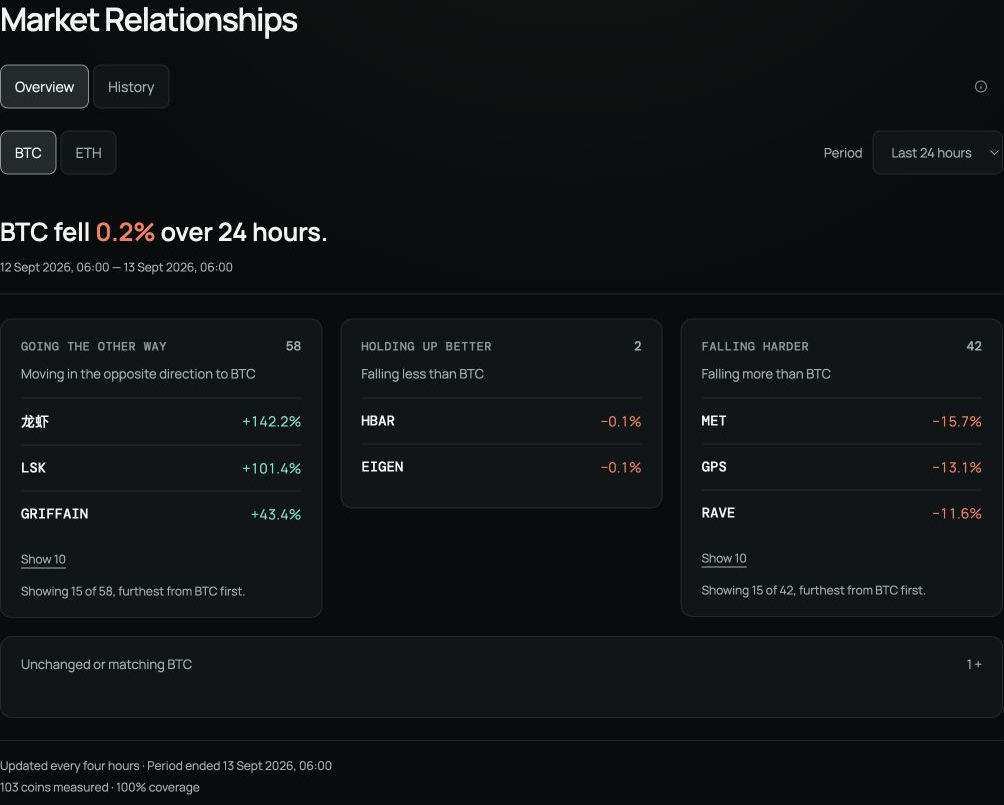
Check the BTC benchmark, 24-hour period and date before comparing the groups. This full-access view shows coins moving in the opposite direction, falling less, or falling more during the same period.
Three checks
- Use the same settings. Check BTC or ETH, the period and the data's date.
- Count the examples. A past percentage is not the chance of the next move.
- Add context and a risk limit. See Coin Rotation and Risk and Position Sizing.
Explore examples
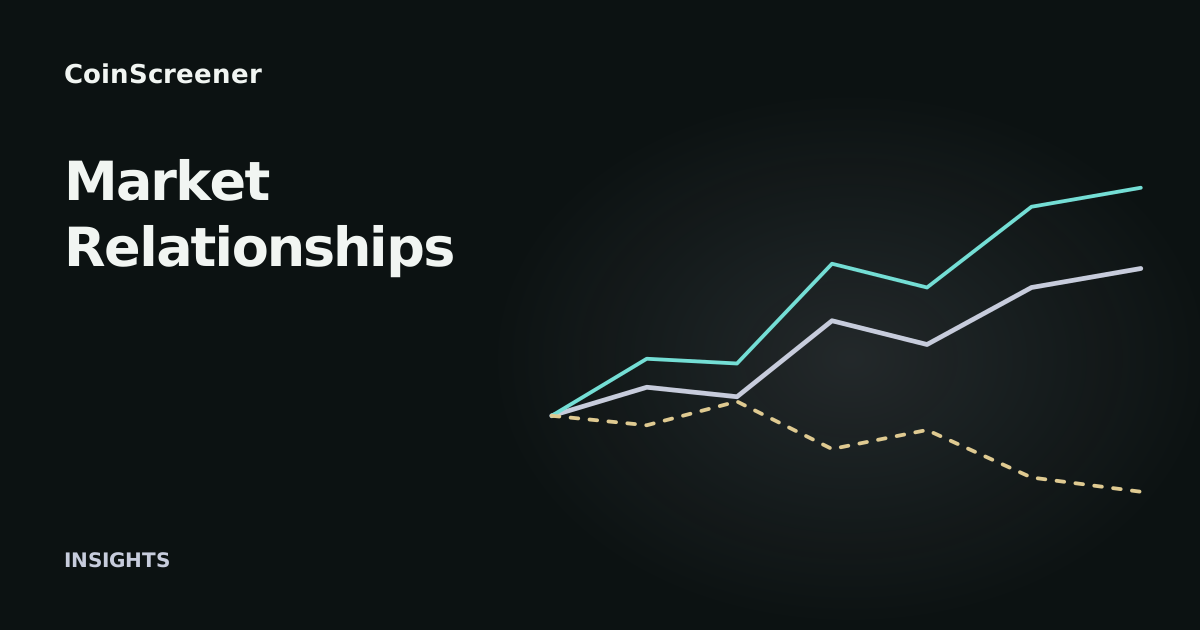
Use the middle line as the reference, such as Bitcoin. The upper line rises more; the dashed line falls. All three cover the same period. These are made-up examples, not predictions.
Sources
Product explanation checked on 13 September 2026. The diagram is conceptual; the product screenshot is a dated capture with full data access.