What it means
Bitcoin can rise while many other coins fall. Market Breadth helps you see whether a move is shared by many coins or just a few.
The main number is the percentage of tracked coins above their own 50-day average. This average adds up a coin's daily closing prices over 50 days and divides by 50. It gives you a reference for comparing today's price with recent prices.
For example, 60% means six out of ten measured coins are above their own average. It does not mean prices rose 60%. Each coin counts once, regardless of its size.
A high percentage can stay high, and a low one can stay low. Neither tells you when prices will reverse. Coin Rotation answers a separate question: which groups are seeing more trading?
In CoinScreener
Open Insights → Market Breadth. Data updates every four hours (4h). Free shows older data; Pro shows the latest available update. Check the date and any notice about older or reconstructed historical data first.
The screen has four main parts:
- Above 50-day average: How many measured coins closed above their own average? Bitcoin (BTC) and Ether (ETH) have separate comparisons. The history chart shows how this percentage changed over time.
- Volume share: How much of the total value traded belongs to BTC and ETH, compared with other coins? A larger share means trading is more concentrated in those two coins. It does not show money entering or leaving crypto.
- Price moves: How many coins rose, fell, or stayed unchanged during the same four hours? Open the lists to see which coins they were.
- Closing highs / lows: Which coins closed at their highest or lowest price in 60 days? A brief price spike does not count unless the closing price qualifies.
The view covers actively traded Binance perpetual futures: contracts with no expiry date. Coverage tells you which coins had enough data to be measured. It does not mean every coin on every exchange. New coins or missing price history can reduce the number included.
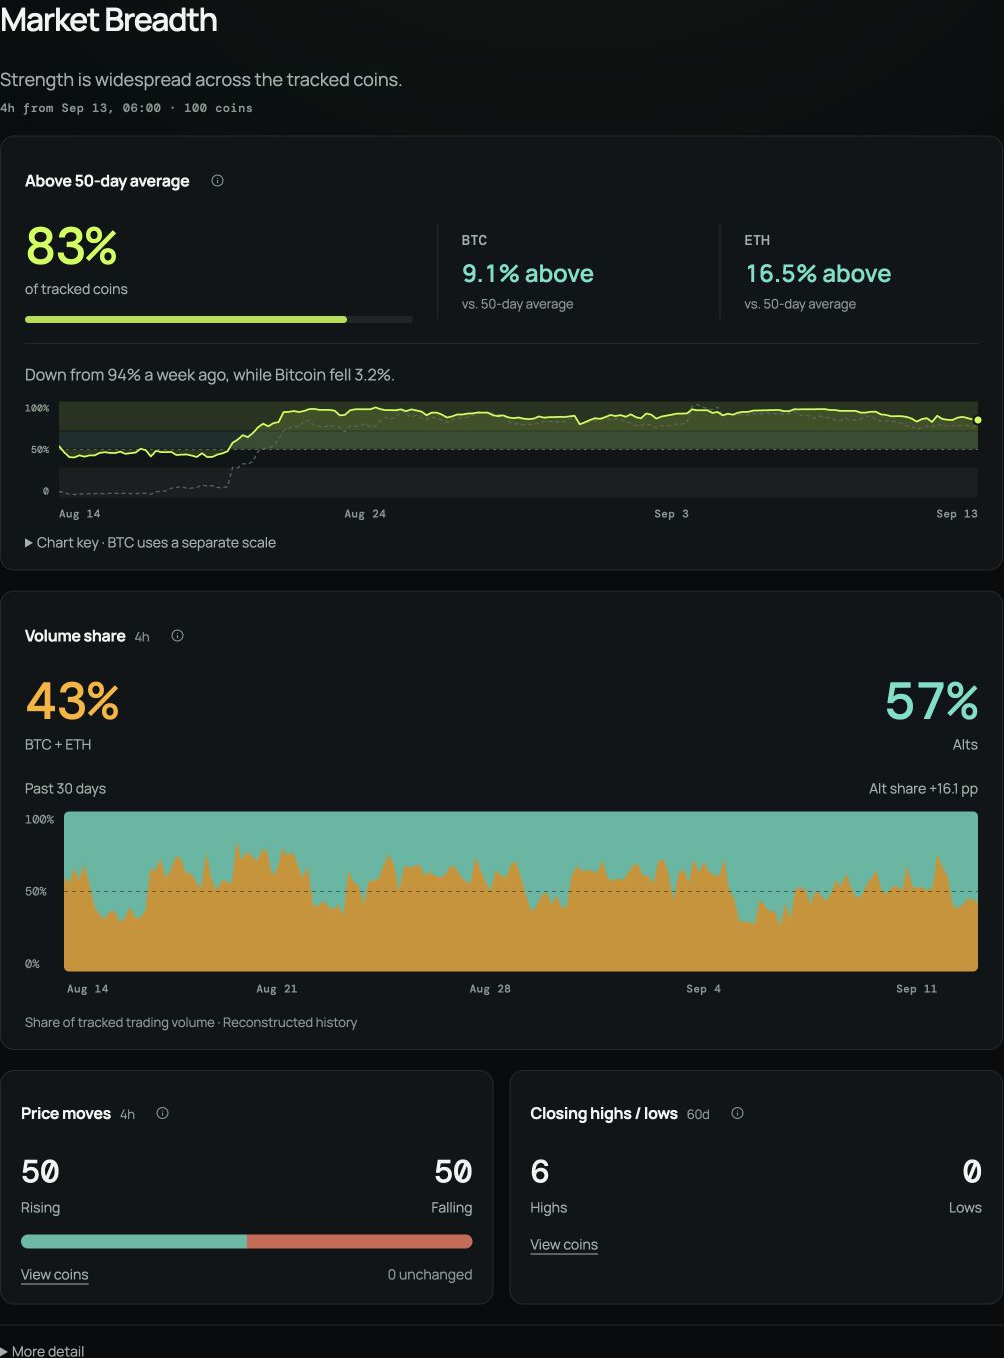
Check the observation date and measured coin count. Compare the share above the 50-day average with BTC and ETH, then read volume share, price moves and closing highs and lows. These are dated observations from the full-access view.
Three checks
- Check the date and coin count. Changes in the coins included can affect comparisons over time.
- Look at individual coins too. Market Relationships compares their moves with BTC or ETH.
- Decide your risk separately. Broad participation does not make a trade safe. Read Risk and Position Sizing.
Explore examples
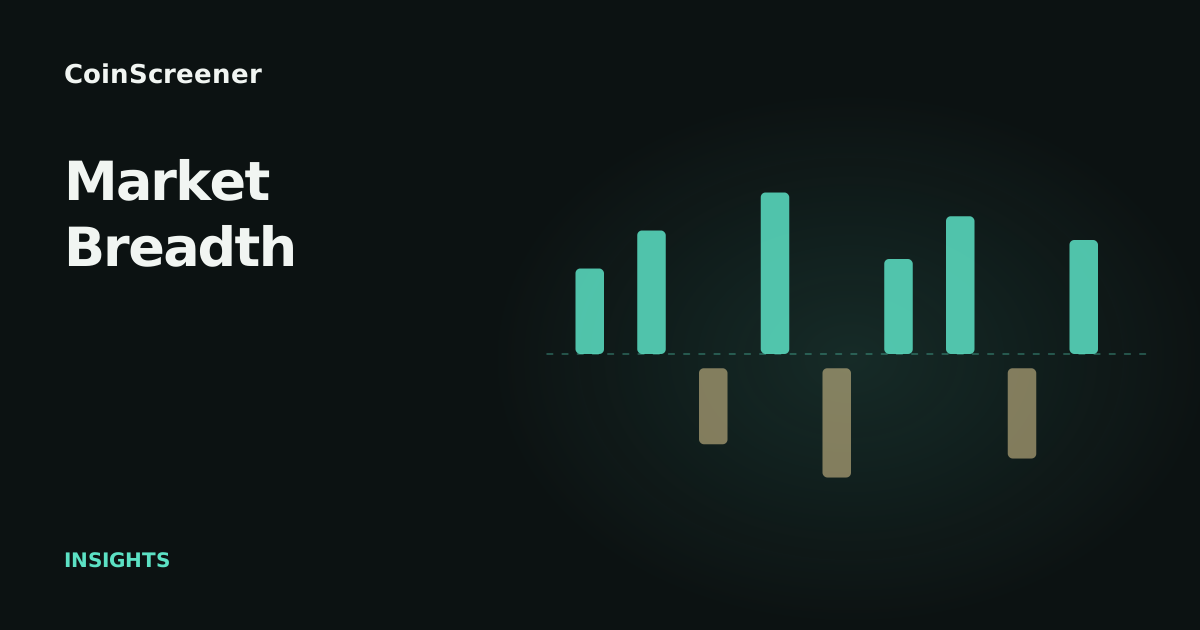
Each bar stands for a coin. Bright bars are above that coin’s own average; pale bars are below it. This example explains the idea. It does not show current prices.
Sources
Product explanation checked on 13 September 2026. The diagram is conceptual; the product screenshot is a dated capture with full data access.
Fidelity: Simple Moving Average · Binance: Kline / Candlestick Data