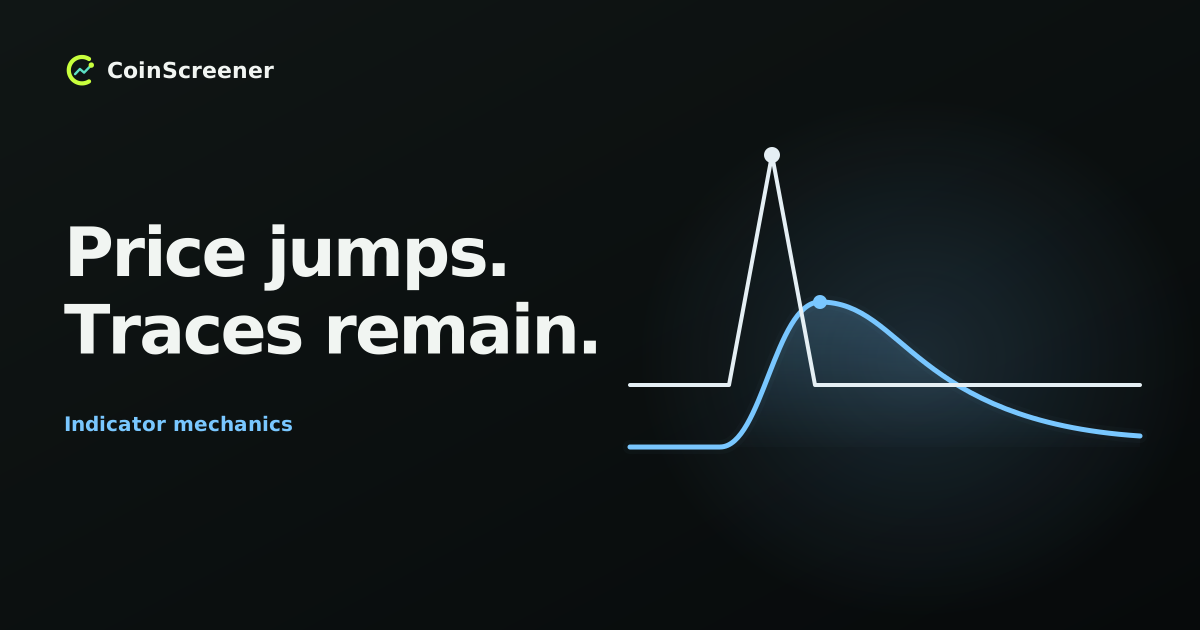
A headline does not enter the RSI formula. A closing-price change does. That distinction becomes useful when a sudden move pushes momentum higher, then reverses before the moving averages have caught up.
This lesson in Read the Reaction follows one invented price sequence through three calculations. It answers a narrower question than our news-versus-technical trading comparison: what exactly changes inside the indicators when price jumps—and when that jump disappears?
Fix the inputs before interpreting the move
Imagine a fictional token quoted in USD on one fictional venue. Use completed one-hour candles, all on the same clock. Start with a close of 100, followed by 101, 100 repeated seven times. That gives fifteen closes and fourteen changes: seven gains of 1 USD and seven losses of 1 USD.
Call the last pre-event close t14. At t15, the next hourly close is 114; at t16, it returns to 100. Imagine an announcement between t14 and t15. These prices and that event are entirely hypothetical, chosen to make the arithmetic visible—not a typical reaction, observed market episode or backtest.
We calculate 14-period RSI using Wilder’s smoothing, a 14-period simple moving average (SMA) and a 14-period exponential moving average (EMA). Seed RSI at t14 from the fourteen changes. Initialize the EMA at t14 with the mean of the latest fourteen closes, 100.50. This explicit teaching initialization need not match a chart using a longer warm-up history.
All prices and averaged changes below are in USD; RSI is a unitless 0–100 reading. Keep full precision between steps and round only the displayed results.
Step one: turn the jump into gains and losses
RSI separates each closing-price change into a gain and a loss magnitude. A rise of 14 has gain 14 and loss 0; a fall of 14 has gain 0 and loss 14. The loss is positive in this calculation.
For fourteen periods, the recurrence is:
- New average gain = (13 × previous average gain + current gain) ÷ 14.
- New average loss = (13 × previous average loss + current loss) ÷ 14.
- RS = average gain ÷ average loss; RSI = 100 − 100 ÷ (1 + RS).
These are the initialization and smoothing conventions documented by StockCharts’ RSI calculation guide. We avoid zero-denominator cases in this example.
At t14, each initial average is 7 ÷ 14 = 0.50, so RS is 1 and RSI is 50.00. At t15:
- Average gain = (13 × 0.50 + 14) ÷ 14 = 20.5 ÷ 14.
- Average loss = (13 × 0.50 + 0) ÷ 14 = 6.5 ÷ 14.
- RS = 20.5 ÷ 6.5, giving RSI ≈ 75.93.
The calculation knows the gain relative to earlier changes. It knows nothing about the announcement’s wording, whether it beat expectations, or why traders acted. Above 70 is conventionally called overbought; it does not establish that price must reverse. Fidelity’s RSI guide notes that extremes can persist during strong trends.
Step two: update the moving averages
An SMA gives equal weight to its included closes. At t14 their sum is 1,407. At t15 the oldest included close, 101, leaves and 114 enters:
SMA = (1,407 − 101 + 114) ÷ 14 ≈ 101.43.
An EMA blends the new close with its previous value. With the conventional multiplier 2 ÷ (14 + 1) = 2/15:
EMA = 100.50 + (2/15) × (114 − 100.50) = 102.30.
See StockCharts’ moving-average formulas for the seed and multiplier. Neither average reaches 114 on this step. Averaging deliberately retains older observations; it cannot anticipate this new close. The EMA responds more strongly here, which is a difference in weighting—not proof of a better trade.
Step three: reverse the entire jump
At t16, price closes back at 100. For RSI, apply a loss of 14 to the unrounded t15 averages. The new average gain is 266.5/196 and average loss is 280.5/196, giving RSI ≈ 48.72. It does not return to 50 because the newer loss receives more weight than the preceding gain.
For the SMA, an old 100 leaves as a new 100 enters. Its value stays 101.43. The EMA becomes 102.30 + (2/15) × (100 − 102.30) ≈ 101.99.
| Candle | Close (USD) | SMA (USD) | EMA (USD) | RSI |
|---|---|---|---|---|
| t14 | 100.00 | 100.50 | 100.50 | 50.00 |
| t15 | 114.00 | 101.43 | 102.30 | 75.93 |
| t16 | 100.00 | 101.43 | 101.99 | 48.72 |
Both averages remain above their starting values even though price has fully retraced. The SMA still contains the 114 close; the EMA retains its diminishing influence. A remaining elevation is not evidence that the favorable-news thesis survives.
As a separate branch, suppose t16 instead also closes at 114. Both RSI averages would be multiplied by 13/14, leaving their ratio—and RSI at approximately 75.93—unchanged. One flat close does not automatically pull Wilder’s RSI toward 50. That is an arithmetic property, not a forecast of what markets will do.
Separate a completed signal from an intrabar glimpse
Our table uses completed candles. If an unfinished candle briefly trades at 114 but closes at 100, you cannot insert 114 as its final close. A live indicator may fluctuate before that close. A rule that waits for confirmation acts later and may miss an initial move; a rule that acts earlier accepts a condition that can disappear.
Neither choice guarantees an executable price. Allow for spreads, fees and slippage, and specify an invalidation rule before treating a reading as a setup. This example shows indicator behavior, not an entry-and-exit strategy.
Reproduce the reading before judging the story
When reviewing a post-news chart, record four things:
- Data: instrument, venue, quote unit, timeframe and exact closes.
- Calculation: lookback, smoothing, initialization and rounding.
- Timing: whether each input was final when the decision was made.
- Interpretation: what the reading establishes, what would invalidate the setup, and which explanation still needs independent evidence.
Our RSI lesson and moving-average guide explain the concepts more broadly. Here the key is reproducibility: identical inputs and conventions produce identical indicator readings whether a headline caused the move or not. The chart alone cannot settle causation or prove that every piece of news is already priced in.
Educational content, not financial advice. All event and price examples are hypothetical. Indicator readings do not guarantee future returns.