Richard Dennis’s Turtle trading lesson is that an entry rule needs a position-sizing rule and an exit plan. A breakout tells you when a price condition has occurred. It does not tell you how much exposure to take or how much a failed trade could cost.
For a crypto trader studying the Turtle rules, that connection is more useful than copying a famous lookback setting. Two markets can produce similar-looking breakouts while exposing the same-sized position to very different price swings.
Richard Dennis, William Eckhardt and the Turtle experiment
In late 1983, commodities trader Richard Dennis and William Eckhardt trained a group of trading apprentices in Chicago. The Original Turtles’ account of the experiment describes their disagreement over whether trading ability could be taught. The students became known as the Turtles.
This was a futures-market example from the 1980s, not a crypto strategy. The published rules describe trading liquid U.S. futures, including currencies, metals and energy.
The taught method was systematic technical trend following: predefined market rules sought participation in a continuing move. That describes this method, not every trade Dennis ever made. The system overview connects market selection, entries, sizing, stops, exits and execution. The original document also allowed choices about market participation and allocation between systems; systematic does not mean every decision was identical across students.
What the breakout rule actually contributed
The rules describe 20-day and 55-day breakout entries, triggered one tick (the minimum price increment) beyond the preceding window’s high or low during the session. They did not require a daily close. The shorter system included a previous-breakout filter and a 55-day fallback; the longer system did not use that filter. This is a selective overview, not the complete trading specification. See the original document’s Entries chapter.
An entry beyond a prior high means price has already risen enough to clear that reference. It cannot identify the cause or tell you how far the move will travel. Waiting for a close or a retest is a different rule: it adds delay, may reject a brief spike and may miss a move that never returns. Test that change rather than calling it the original method.
A news trader may instead start with a catalyst, meaning a release or event that could change expectations. Combining that thesis with a price trigger is possible, but it creates another method. Our news-versus-technical comparison explains the distinction. Price-derived measures do not read headlines, prove that all news is priced in or predict announcements.
N: measuring movement before choosing size
The Turtles called their volatility measure N. The Position Sizing chapter specifies a 20-day true-range average, seeded with a simple average and updated as N = (19 × previous N + today’s true range) ÷ 20. Historical units linked a 1N move to 1% of the sizing account; the standard initial stop was 2N away. Those are historical parameters, not suggested risk settings.
True range takes the largest of the current high minus low, the absolute high-to-previous-close difference and the absolute low-to-previous-close difference. Average true range (ATR) measures movement in price units, not direction or a probability. Fidelity’s ATR reference explains the calculation. A chart’s default ATR period and smoothing may differ from N.
This matters when interpreting “1%”: a unit whose 1N move represents 1% has an approximate 2% price loss at a 2N stop, before costs, for that initial unit. It is not a guaranteed 1% maximum loss. Position size, stop distance and total account risk are different quantities.
A hypothetical crypto exercise: twice the movement, half the size
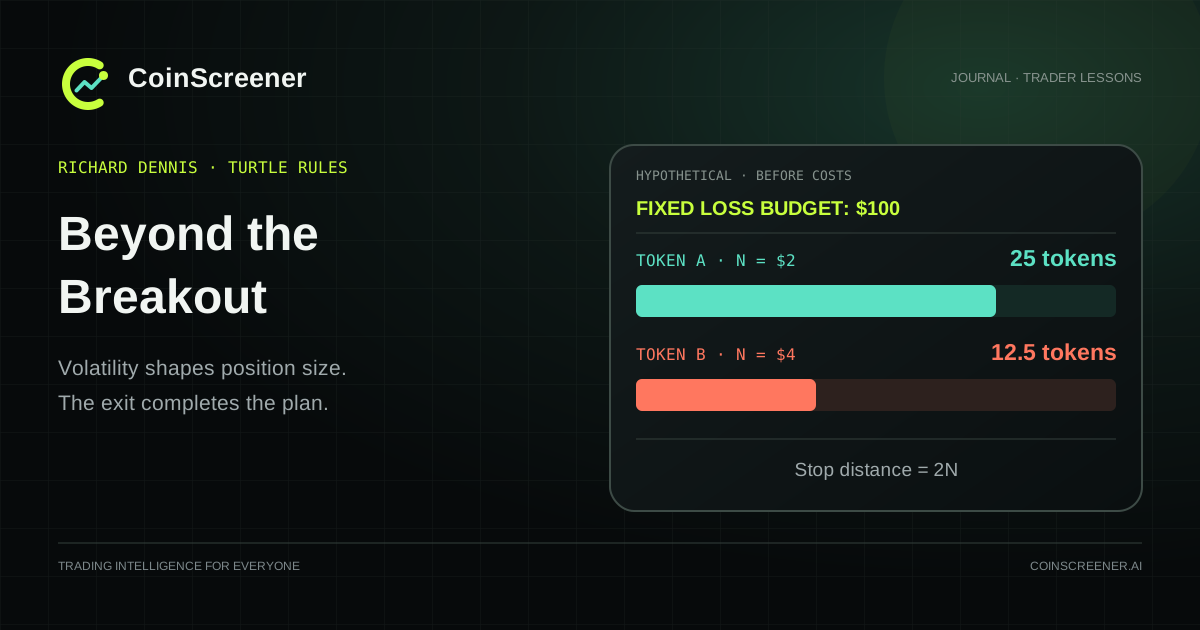
The following is an original arithmetic exercise, not a Turtle trade, market observation or backtest. Assume two fictional spot tokens each cost $100, allow fractional quantities and have linear dollar profit and loss. Use a fixed $100 planned loss budget and an illustrative stop distance of 2N. Ignore costs initially.
- Token A: N = $2 per token; stop distance = $4; quantity = $100 ÷ $4 = 25 tokens. Notional exposure is $2,500.
- Token B: N = $4 per token; stop distance = $8; quantity = $100 ÷ $8 = 12.5 tokens. Notional exposure is $1,250.
At exact entry and stop fills, each position loses $100. Buying 25 of both would instead expose Token B to $200 of planned price loss. Equal token quantities, or equal dollars invested at the same entry price, do not equalize this stop-based risk.
Now assume estimated round-trip fees and slippage total $0.20 per token. The quantities become 100 ÷ 4.20 ≈ 23.81 and 100 ÷ 8.20 ≈ 12.20, before rounding down to valid order increments. Costs change the exact ratio. An adverse exit gap can still exceed the budget.
These figures isolate one sizing decision. They do not reproduce historical Turtle unit sizing, adding to positions or portfolio limits. For contract multipliers and a broader sizing workflow, use the risk-management guide.
A failed breakout still belongs in the plan
Suppose Token A enters at $100 with an intended exit at $96, using the initial 25-token, before-cost quantity. Price first rises to $102, then reverses. An exact $96 exit loses $100; a $95 fill loses $125 before fees. These are hypothetical paths, not a statement about how often either occurs.
A stop level is therefore a planning input, not a promise. Investor.gov’s order explanation describes how a stock stop order becomes a market order and how market-order prices are not guaranteed. Check the actual crypto venue’s trigger and order rules. A limit on execution price introduces the possibility of no fill.
Also define what happens if the trade stays profitable. Selling at the first small gain and allowing the full planned loss creates a different payoff pattern from holding for a trend exit. Neither choice can be evaluated by looking only at the entry screenshot. Record the entire path, actual fills and skipped trades.
What needs fresh testing in crypto?
Treat the historical method as a research starting point. Before drawing conclusions, specify:
- The data clock: venue, instrument, daily boundary and timezone. A 24/7 crypto calendar differs from historical futures sessions.
- The exact rules: previous completed bars only, intraday or close-based entry, volatility smoothing, exits and any additions. Do not use a day’s final high before that day ends.
- Executable costs: spreads, fees, slippage and, for perpetuals, funding and liquidation constraints. Model the instrument you would actually use.
- Portfolio exposure: several token longs may lose together. Matching individual volatility does not establish independence or cap combined losses.
- Failure evidence: include sideways periods, losing streaks and markets that disappeared from the dataset. Keep an untouched evaluation period and test nearby parameters, rather than reporting only the best setting.
Our guide to backtests and live results explains how to read those assumptions. No return or win-rate claim is made here, and Dennis’s history is not evidence that these settings produce an edge in crypto.
The useful exercise is to write the whole decision before the breakout: what allows entry, what determines quantity, what ends the trade and what limits combined exposure. That is a concrete lesson to take from the Turtle process while testing your own assumptions.
Educational material, not financial advice. All token prices, quantities, costs and trade paths above are hypothetical. Historical rules do not guarantee future results.