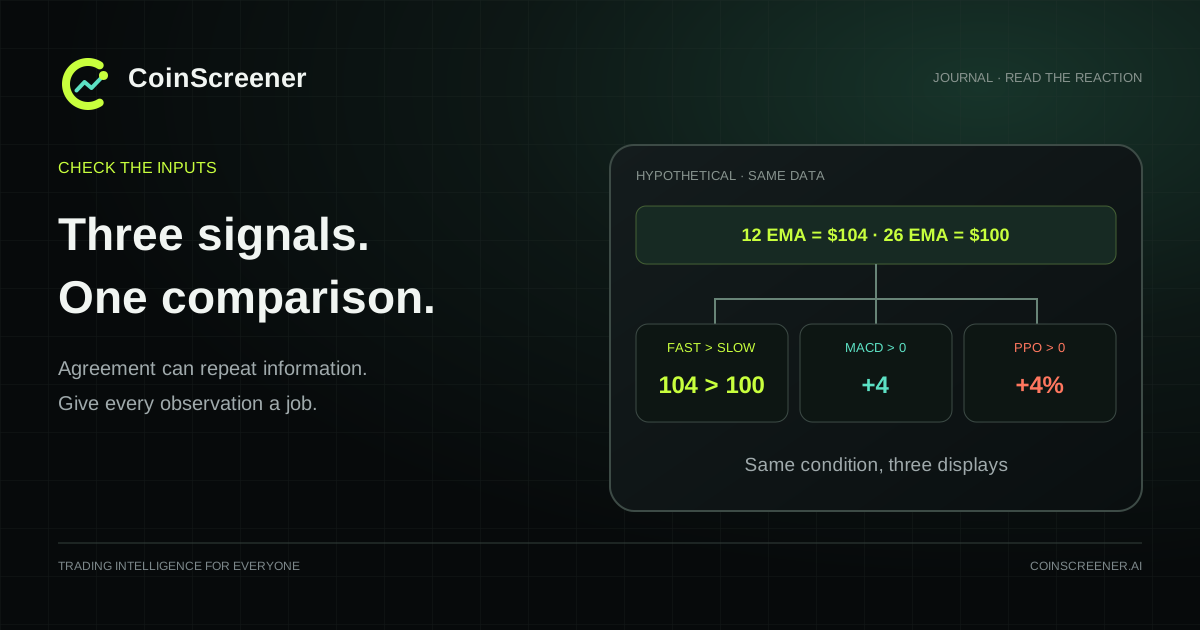
Three bullish indicators can be three displays of one condition. Before treating agreement as confirmation, check what each tool calculates and what decision it changes.
This is the first lesson in Read the Reaction, our technical-trading education series. The question is specific: when indicators line up on a crypto chart, are you learning something new or counting the same observation again?
Start with the condition, not the indicator name
Traders often call agreement between tools confluence. But “MACD is bullish” is too vague to audit. Does it mean the MACD line is above zero, above its signal line, or rising? Those are different conditions.
An exponential moving average, or EMA, smooths prices while giving more weight to recent observations. With the common 12/26 settings, the MACD line is the 12-period EMA minus the 26-period EMA. Its signal line is a separate smoothed series. Fidelity’s MACD guide describes the calculation.
The Percentage Price Oscillator (PPO) expresses that EMA difference as a percentage of the slower EMA. StockCharts’ PPO documentation supplies the formula. Changing the scale can help comparison; it does not automatically supply another directional observation.
A worked example: three checks, one comparison
Assume a fictional token’s completed one-hour candle has 12-period EMA = $104 and 26-period EMA = $100. These are hypothetical indicator inputs, not a recorded trade or a backtest. Use the same venue, instrument, closing-price series, EMA initialization and settings throughout.
- Fast EMA above slow EMA: $104 is greater than $100.
- MACD line above zero: $104 − $100 = +$4.
- PPO line above zero: ($104 − $100) ÷ $100 × 100 = +4%.
All three checks pass because the fast EMA is above the slow EMA. For these definitions and a positive slow EMA, they are mathematically equivalent. Requiring all three selects exactly the same candles as requiring the first alone. It does not create three independent reasons to expect a rise.
The 4% is the EMA gap relative to the slow EMA. It is neither a forecast return nor a probability of profit. And “above” describes a state: it does not establish that a crossover happened on this candle.
This equivalence concerns the lines’ positions relative to zero. It does not say that MACD and PPO signal-line crossovers, histograms or divergences always coincide. Different settings, data or implementations also require a fresh comparison.
What if the third indicator is RSI?
RSI is not simply another scale for that EMA gap. It compares smoothed upward and downward closing-price changes; Fidelity’s RSI guide explains its formula. RSI and MACD can disagree because they summarize price history differently.
Yet adding RSI does not establish independent confirmation. Both consume the price series. Shared inputs do not prove that every pair of rules is redundant, and different formulas do not prove that their agreement improves a strategy.
John Bollinger’s fourth published rule cautions against combining directly related indicators. Use that as a prompt to inspect overlap, rather than as proof that any particular crypto combination works or fails. Our RSI lesson provides the background without treating a high reading as an automatic reversal.
Give each observation a job
Instead of collecting bullish votes, write down the question each observation answers:
- Trend context: which price condition defines the environment you want to study?
- Entry timing: what new event permits action, and when is it knowable?
- Trading activity: what does measured volume add about the amount traded on the specified venue and interval?
- Execution: does the current spread and available liquidity allow the planned order within your cost assumptions?
- Invalidation: what would make you abandon the idea?
Volume is a different measurement from closing price, but price and volume may respond to the same activity. Calling it statistically independent requires evidence. Likewise, a narrow spread can help assess execution without predicting direction. These observations have different jobs; they are not interchangeable votes.
For an event-based idea, keep the catalyst separate from its price reaction. A bullish chart does not verify a headline or establish its cause. See our news-versus-technical comparison for that distinction.
Test what the extra condition changes
Start with a written baseline rule. Add one condition while keeping the market sample, execution convention, exits, position-sizing method and cost assumptions fixed. For example, both versions might submit an order only after a qualifying candle closes. Record which eligible setups the addition rejects and whether it delays entry. Keep rejected and losing cases in the comparison.
For the exact EMA/MACD/PPO checks above, an added condition should reject nothing when calculated consistently. Unexpected differences are a reason to inspect inputs, timestamps, rounding and implementation before crediting a trading benefit.
For a genuinely different filter, evaluate the changed trades after fees and slippage, including drawdowns and the number of observations. Check on later data that was not used to choose the filter. Fewer trades or a higher win rate alone does not establish better net results. This is a proposed research process, not a reported experiment or a recommended strategy.
An indicator audit you can reuse
Before adding another panel, complete these five lines:
- Input and settings: market, venue, timeframe, source prices and calculation settings.
- Exact condition: a comparison another person could reproduce.
- Role: context, trigger, activity, execution or invalidation.
- Removal test: which decisions change if this condition disappears?
- Evidence: what testing supports keeping it, including failures and costs?
If the removal test changes nothing, the panel may still be a convenient display. Count its usefulness as presentation, not an extra confirmation. Keep the risk plan explicit: a stack of agreeing indicators cannot choose an acceptable loss for you.
Educational content, not financial advice. The numerical example is hypothetical; indicator agreement does not guarantee a profitable trade.