A marker on yesterday’s chart does not prove that a trader could see it yesterday. Some markers change while a candle is still forming. Others are added only after later candles confirm a pattern, then placed on the earlier turning point. To evaluate either, ask when the information became available.
This lesson concerns chart timing, not whether a particular signal is profitable. The two exercises below are separate, fictional USD-quoted spot-market examples. They describe teaching rules, not CoinScreener’s implementation, recorded prices or executed trades.
Start with the behavior, not the label
TradingView’s repainting documentation uses a broad definition covering differences between historical and realtime calculations or plots, including plotting into the past. Consequently, repainting and late confirmation are not mutually exclusive labels. Neither label alone tells you whether a chart is useful for your decision.
Ask a narrower question: did an unconfirmed condition change, or did a later observation establish something about an earlier candle? A useful explanation names the input, the rule and the first moment that rule could be satisfied. “It never repaints” without those details is difficult to test.
A live marker that disappears before the close
In our first exercise, a one-minute candle runs from 12:00 to 12:01 UTC. A provisional marker is visible whenever the latest price is strictly above a fixed reference of 100 USD per token. This is a state condition, not a crossover rule. Assume the updates shown have already reached the chart at the stated observation times.
| Observed time and price | What the rule knows |
|---|---|
| 12:00:20 UTC: latest price 101. | 101 > 100. The provisional marker is visible; the candle is unfinished. |
| 12:00:50 UTC: latest price 99. | 99 < 100. The condition is now false and the provisional marker disappears. |
| 12:01:00 UTC: completed close 99 is received. | The close is below 100. A rule requiring a completed close above 100 produces no confirmed signal. |
The 12:00:20 observation was real within this invented sequence; it was simply provisional. Treating it as a confirmed close would change the strategy. A later historical chart can omit that temporary marker without showing what you saw during the minute.
TradingView’s execution-model documentation describes replacing temporary plotted outputs on realtime updates. It also distinguishes chart rollback from persistent alert logs. A notification record and a later chart therefore need not display the same thing. Check the actual script and alert settings before drawing conclusions.
A pivot that becomes knowable later
Now use a separate fictional sequence. Each one-minute candle is labeled by its opening time. Its completed high, in USD per token, is:
- 11:58 UTC: 98
- 11:59 UTC: 99
- 12:00 UTC: 103
- 12:01 UTC: 101
- 12:02 UTC: 100
Define our pivot high as a candidate whose high is strictly greater than the highs of the two completed candles on each side. Equal highs fail this particular rule. This is our illustrative definition, not a claim about every pivot indicator.
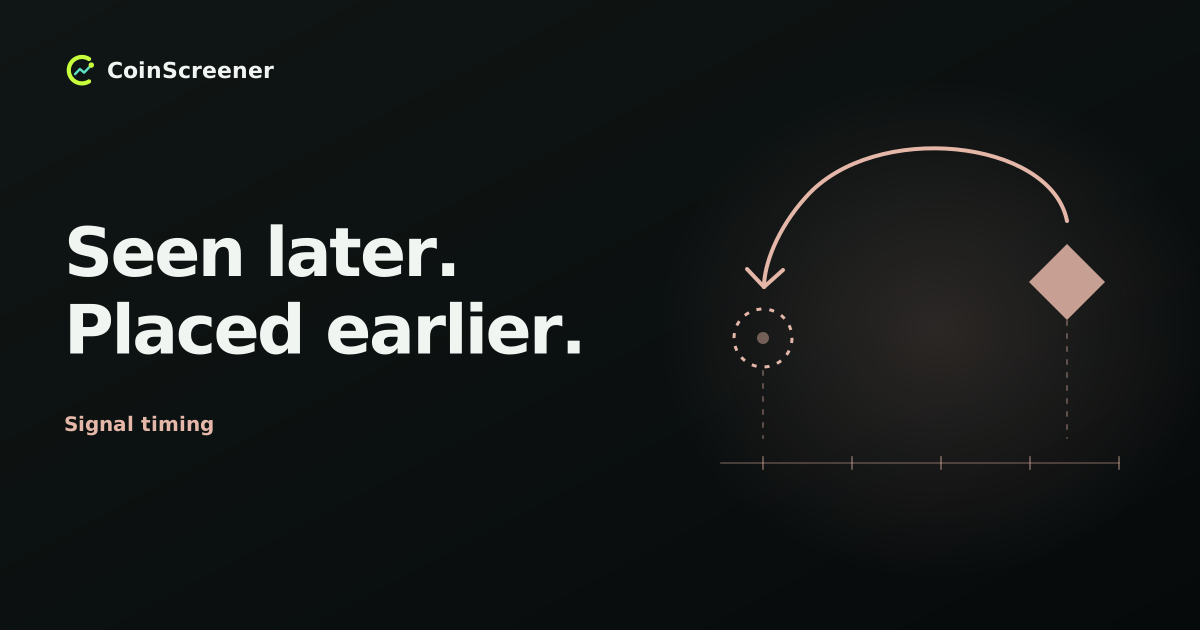
The 12:00 candle finishes at 12:01 UTC. At that moment, the two right-hand candles are not both complete. The second right-hand candle runs from 12:02 to 12:03 UTC. Confirmation is possible no earlier than 12:03 UTC, and only once its completed data has arrived. The required comparisons then pass: 103 is greater than 98, 99, 101 and 100.
A chart may place the confirmed marker on the 12:00 candle to identify the turning point. That location is not its availability time. Crediting a decision at 12:00 with this confirmation would use information from the future. With unchanged data and this fixed rule, later candles beyond these two right-hand neighbors do not change this pivot decision.
Separate chart time from decision time
Keep three timestamps: the candle being described, the first confirmation time, and when your system received the result. A plotted candle timestamp can differ from both of the others. Our look-ahead lesson applies the same information-availability discipline to news and backtests.
For a script using several timeframes, identify which input must finish. A completed five-minute chart candle does not itself finish an hourly input. TradingView’s bar-state reference documents confirmation at the closing update and warns that its confirmation flag does not work inside a request.security() call. “Wait for the close” needs a specified source and timeframe.
The RSI-divergence guide explains the pattern. This timing exercise explains why recognizing a turning point later is different from receiving an actionable observation at that turning point. Neither establishes an executable fill. The same-candle backtest lesson addresses that separate problem of hidden price order.
Keep a small observation log
Before relying on a chart signal, record:
- Venue, full pair, instrument, timeframe, script version and inputs.
- Observation time, candle opening and closing times, and whether each required input is complete.
- A screenshot and the exact condition being tested, including strict versus inclusive comparisons.
- First confirmation and receipt times, alongside any separate notification record.
- What remains after reloading with the same settings and data source.
If the marker changes, preserve both observations. Check unfinished inputs, later confirmation and plotting offsets first; also investigate changed settings or revised source data. Do not erase a failed observation from the record just because the finished chart looks cleaner. If the provider cannot explain availability, leave the signal unevaluated rather than assigning it an earlier entry.
Evaluate the evidence you could actually have used
For the provisional example, a close-based evaluation has no confirmed above-reference signal. For the pivot example, evaluation begins after confirmation data arrives, not at the earlier candle carrying the marker. Costs, delay and execution remain additional questions.
Use the signal-reading guide to inspect a setup’s fields and the evidence checklist to assess provider claims. Keep the live observation and the later chart together: they answer different timing questions.
Educational information, not financial advice. All numbers and timelines here are hypothetical. A confirmed chart condition does not predict a profitable outcome.