If a candle’s range includes both your stop and target, the candle alone may not identify the first exit. A backtest can still print a precise result, but that result may depend on an assumed price sequence. Precision in the report does not restore information missing from the data.
Here, “hit” means a price level was reached in a hypothetical path. It does not prove an order filled. This lesson uses an original, deliberately simplified example to separate three questions: what the candle records, what the simulator assumes, and what execution evidence would be needed.
Fix the position before examining the candle
Imagine one token bought earlier at 100 USD on a fictional spot venue. The long position is already open before the 12:00–12:30 UTC interval begins. A stop at 96 USD and a target at 106 USD are both active throughout the interval until the first exit. All prices are USD per token.
For this exercise only, assume a continuous path through the intervening prices, immediate full execution at the first exit level reached, automatic cancellation of the other exit, and no re-entry. Ignore fees, spread, slippage and other costs. These are teaching assumptions, not a description of any venue or CoinScreener strategy.
The completed candle has open 100, high 108, low 94 and close 102. The high exceeds the target and the low is below the stop. Which order closes the position?
Build two paths with identical OHLC
OHLC means open, high, low and close. Those four values summarize an interval without preserving every movement inside it. The candlesticks and timeframes guide explains the basic reading; the missing sequence becomes decisive when two exits compete.
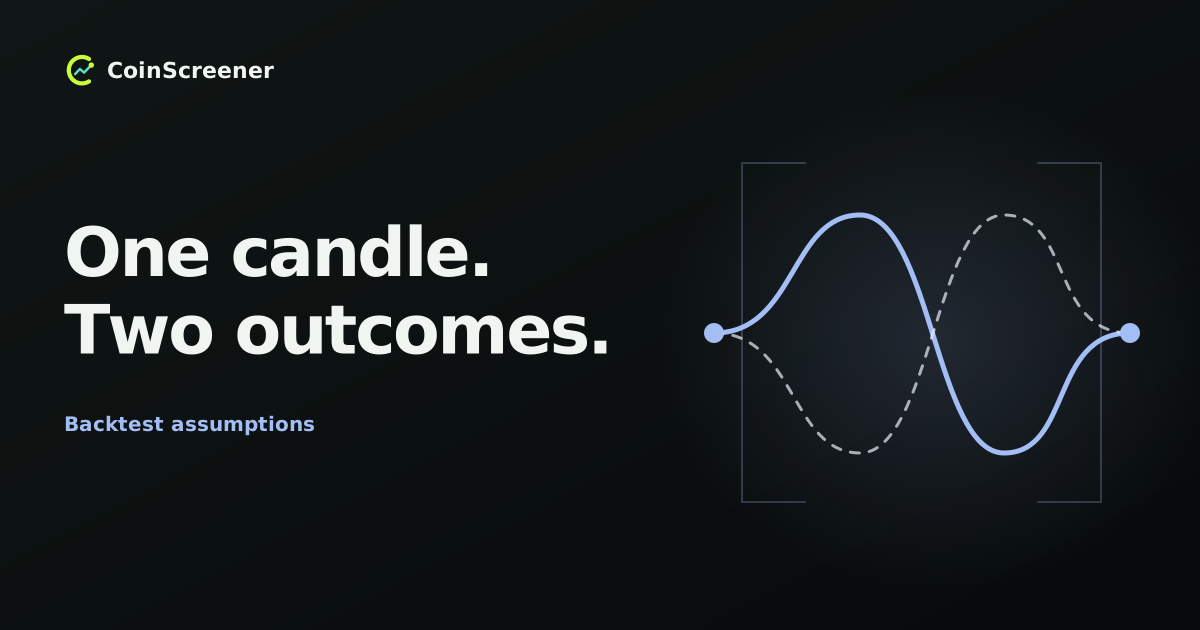
Consider these two invented paths. Each arrow describes movement through all intervening prices, not a jump. The listed points give their order, not measured timestamps or equally spaced observations.
| Path | First exit under the stated assumptions |
|---|---|
| A: 100 → 108 → 94 → 102 | Target 106 first. The position closes before the later decline. Gross result: 106 − 100 = +6 USD. |
| B: 100 → 94 → 108 → 102 | Stop 96 first. The position closes before the later rally. Gross result: 96 − 100 = −4 USD. |
Both paths produce exactly the same candle. Its positive close cannot distinguish the +6 USD outcome from the −4 USD outcome. The difference is 10 USD for one token, before costs, solely because the assumed ordering changed.
Do not count the second exit as another trade: the first already closed the position and canceled the remaining exit in this exercise. These are two alternative scenarios, not two successive trades or observed performance. Their existence does not imply equal probabilities.
Identify the simulator’s tie-breaking rule
A simulator might select an OHLC path, prioritize the stop, prioritize the target, or flag the bar as unresolved. Those policies can make a run reproducible; they do not establish the historical sequence.
TradingView’s strategy documentation describes default intrabar path assumptions. Its higher-detail mode uses available lower-timeframe bars; gaps in that coverage revert to default assumptions. Check your simulator’s documented behavior and saved settings rather than assuming every engine resolves the same candle identically.
For this one fixed position, stop-first yields the lower of the two simplified results. It is not a universal worst-case bound: a real stop can fill worse, and changing exits can change later positions in a multi-trade strategy. Do not choose the policy after seeing which one makes the report look better.
Use finer data without overstating it
Smaller candles can separate the two events if the first relevant crossing occurs in an earlier sub-bar. But if one smaller candle still contains both levels, the ordering question remains inside that smaller interval. More detail reduces some uncertainty; it does not automatically eliminate it.
Check that the finer data describe the same venue, instrument, price source and timezone boundaries as the tested orders. Record missing intervals instead of treating missing observations as no activity. For stops using different reference prices, read the separate last, mark and index price lesson.
Even an ordered trade record does not prove your order would have filled at that price and size. Queue position, available liquidity, routing delay and the actual order rules still matter. Our volume-versus-liquidity example explains why recorded activity cannot substitute for executable depth.
Keep entry timing out of the hindsight trap
The example deliberately starts with a position already open. If a different strategy decides to enter only after the 12:30 UTC close, it cannot use an earlier touch of 106 or 96 to exit an order that did not yet exist. If entry occurs during the candle, reconstruct when the entry and protective orders became active before testing either exit.
This is separate from uncertainty about which exit happened first. The news-backtest timing lesson examines information and order availability. A defensible simulation distinguishes known timestamps from assumed intrabar ordering. Neither correct chronology nor a documented path rule guarantees an executable fill.
Report the ambiguity with the result
Save a small audit record alongside the backtest:
- Position: side, size, entry and when each exit became active.
- Data: venue, instrument, price source, interval and finer-data coverage.
- Policy: path or priority rule, cancellation behavior, gaps and fill assumptions.
- Exposure to uncertainty: count and identify bars whose ordering could change an exit.
- Sensitivity: compare predeclared plausible policies with costs held consistent; preserve unresolved cases and explain exclusions.
Silently deleting ambiguous trades changes the sample. Report them and show how conclusions depend on the assumptions. Continue with the backtests and live results guide to assess the broader record.
Educational information, not financial advice. All example prices, paths and outcomes are hypothetical. A transparent backtest explains what remains unknown; it does not guarantee future returns.