What it means
In Richard Wyckoff's schematic, a trend ends in a climax, a trading range holds it, and price then closes out of the far side. Wyckoff read the range as large traders building or unloading a position. Distances are in ATR, the 14-candle average true range, so one rule fits calm and volatile markets.
Wyckoff Accumulation follows the schematic upward:
- Selling climax (SC): a swing low at a 40-candle low, at least 6 ATR under those candles' highest high. It or a neighboring candle needs volume at least two standard deviations above the previous 50.
- Automatic rally (AR): the highest high within 15 candles of the climax, at least 3 ATR above it. The climax low is the range bottom; the rally high is the range top.
- Secondary test (ST): a later swing low within 1 ATR of the climax low.
- Spring: optional. A dip under the range bottom, no deeper than 1.5 ATR, that closes back above it within three candles.
- Sign of strength (SOS): the first close more than 1 ATR above the range top that is also the highest close since the climax, 20 to 100 candles after it. The alert fires on that close.
Wyckoff Distribution is the mirror: a buying climax (BC) at a 40-candle high, an automatic reaction (AR) that sets the range bottom, a secondary test (ST) of the high, an optional upthrust (UT), and a sign of weakness (SOW) closing more than 1 ATR below the range bottom.
Wyckoff LPS (last point of support) is the first swing low within 20 candles of the SOS that holds near the old range top: no more than 1.5 ATR above it, with nothing since the break trading more than 1 ATR below it. A pullback back into the range is a failed break, with no LPS.
Wyckoff LPSY (last point of supply) is the mirror: the first bounce after the SOW that fails near the old range bottom.
In CoinScreener
All four alerts support 1h, 4h and 1D. A range lasts 20 to 100 candles: days on 1h, months on 1D. Match the exchange, market and timeframe when comparing another chart.
Open Alerts and select Wyckoff Accumulation, Wyckoff Distribution, Wyckoff LPS (Last Point of Support) or Wyckoff LPSY (Last Point of Supply).
- Range top / Range bottom: the two edges, set by the climax and the automatic rally (reaction).
- Range height: the distance between them as a percentage of the bottom. It is not a target or expected return.
- Pullback low / Bounce high: on LPS and LPSY, the swing that held, next to the broken edge.
The chart draws both edges and labels each point.
Each range alerts once at the break and at most once at the pullback; a nested range does not alert twice. LPS and LPSY arrive once three later candles confirm the swing.
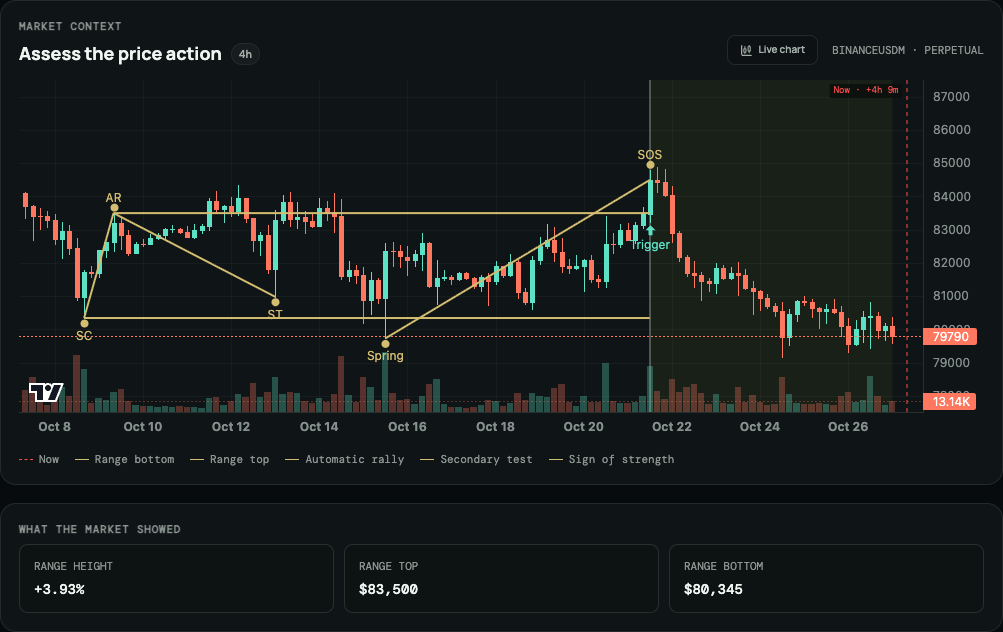
A recorded Wyckoff Accumulation in CoinScreener, with both range edges, the path labelled SC, AR, ST, Spring and SOS, and evidence cards for range height, range top and range bottom. This is a historical replay example, not a live notification.
Three checks
- Confirm the climax stands out on volume, and treat the broken edge as the level that invalidates the idea.
- Remember that range breakouts often give back part of the move, and a close back inside the range weakens the idea.
- Compare the current price with the broken edge, and set your own exit and size before any trade.
Explore examples
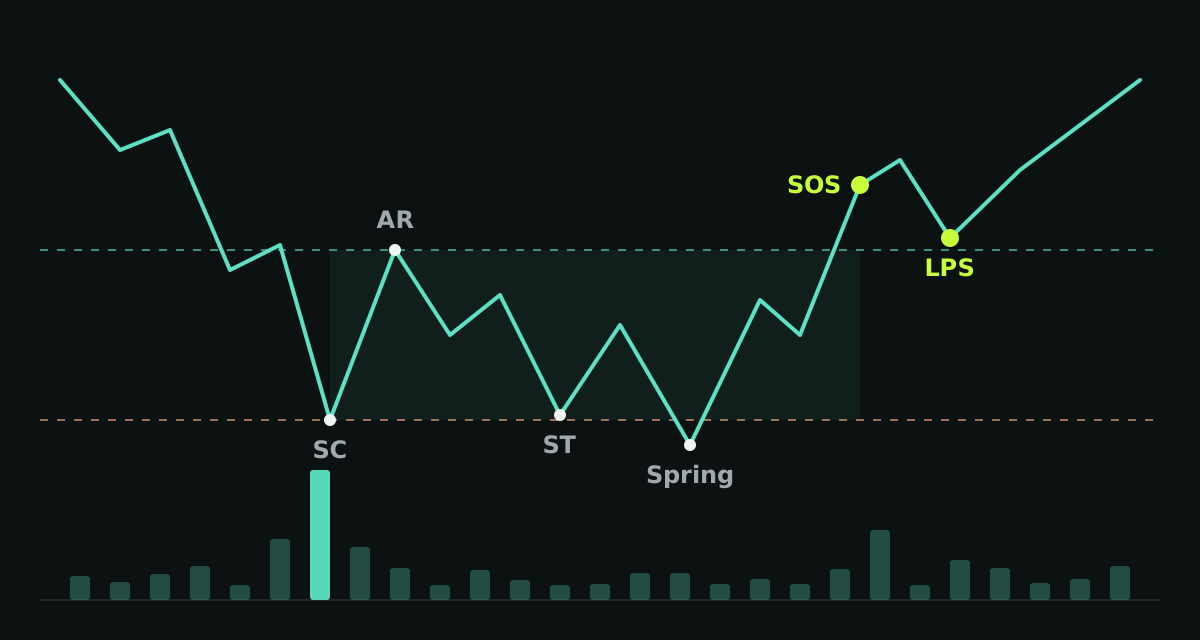
Read it left to right. Distribution is the same drawing upside down: buying climax, upthrust, sign of weakness, last point of supply. Only the SOS (SOW) and the LPS (LPSY) send an alert.
Sources
Product behavior checked against V3 source on 27 October 2026. Screenshots retain their original capture dates.