
Be wary and educate yourself on how to read reliable signals if you want to start trading cryptocurrencies.
Trading crypto requires a variety of analytical tools and indicators. Relative Strength Index (RSI) is one (RSI). The RSI is one of day traders' most popular indicators, and applying it properly will make it a valuable tool.
So, what is the Relative Strength Index, and how can you use the Relative Strength Index in your crypto trades? Let's find out in this article!
What Is the RSI?
The RSI (Relative Strength Index) is a popular technical analysis indicator used to determine the strength of a particular trend. In the context of cryptocurrency trading, the RSI is used to analyze the price movements of a specific digital asset and help traders identify potential buying or selling opportunities.
The RSI is a momentum oscillator that ranges from 0 to 100 and is calculated based on the average gains and losses of an asset over a specific period of time. A reading above 70 is considered overbought, and a reading below 30 is considered oversold, suggesting that the asset may be due for a trend reversal.
However, it's important to note that the RSI is just one tool in a trader's arsenal and should not be relied on solely to make investment decisions. Technical analysis should be used in conjunction with other forms of analysis, such as fundamental analysis and market sentiment, to form a comprehensive investment strategy.
How the RSI Works
The RSI works by calculating the ratio of the average gains to the average losses of a security over a specified time period, typically 14 periods. The resulting value is then scaled from 0 to 100, with a value of 50 considered neutral. Values above 50 indicate that the security has been gaining more than it has been losing and is considered bullish, while values below 50 indicate the opposite and are considered bearish.
To calculate the RSI, the average gains over the specified time period are first determined by calculating the difference between each period's closing price and the previous period's closing price, and summing all of the positive differences. This sum is then divided by the number of periods to obtain the average gain.
Next, the average losses over the specified time period are determined in a similar manner, but this time, the sum includes only the negative differences between each period's closing price and the previous period's closing price. This sum is then divided by the number of periods to obtain the average loss.
The ratio of the average gain to the average loss is then calculated, and this value is plugged into a formula to obtain the RSI.
It's important to note that the RSI is a momentum oscillator, meaning that it's designed to help identify overbought and oversold conditions in an asset's price, as well as potential trend reversals. However, like any technical indicator, the RSI should not be relied on solely for investment decisions. It's always best to use multiple indicators and analysis techniques to form a comprehensive investment strategy.
Overbought and Oversold Positions
An overbought position occurs when the price of a security has increased too quickly and has reached a level at which further price gains are unlikely. This can be indicated by the RSI reaching above 70, which is often considered the overbought level.
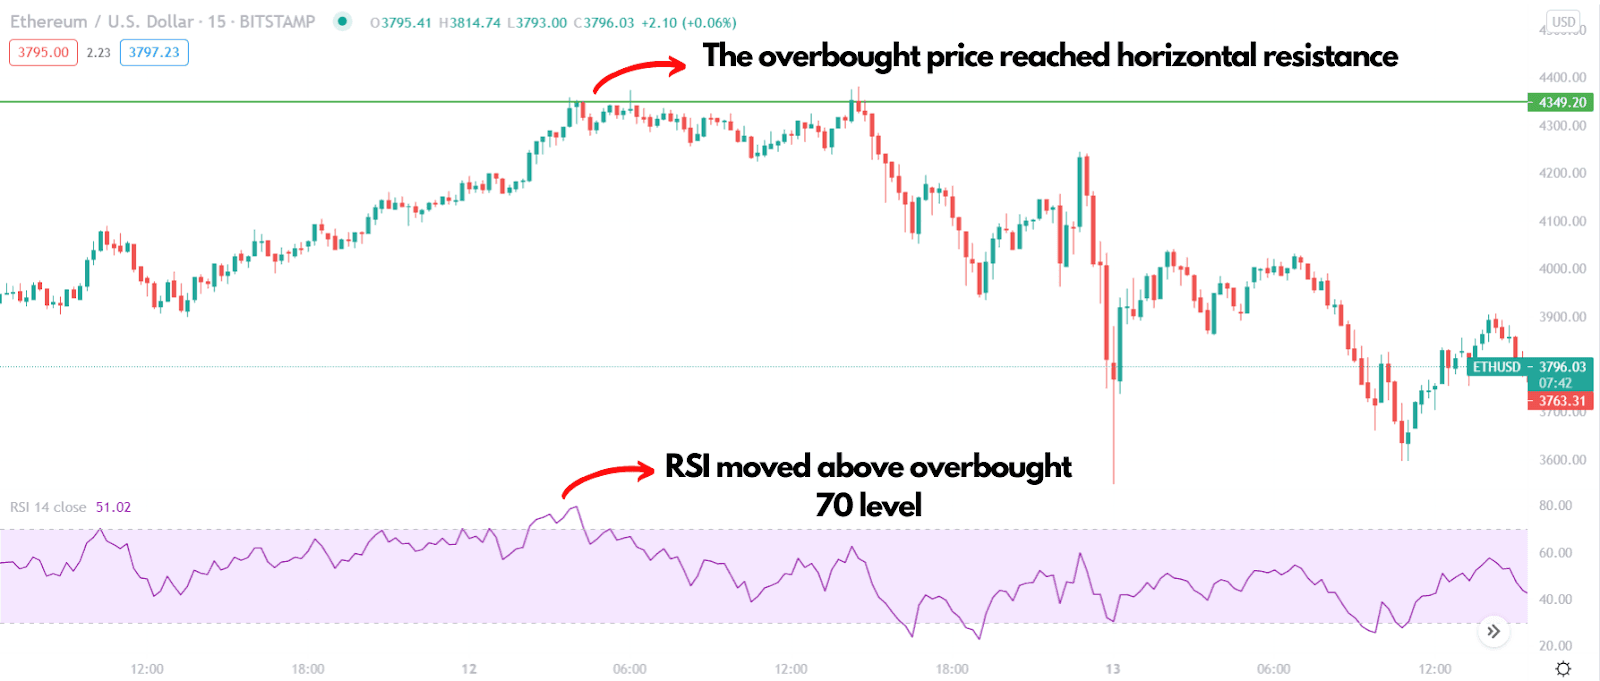
An oversold position occurs when the price of a security has decreased too quickly and has reached a level at which further price losses are unlikely. This can be indicated by the RSI reaching below 30, which is often considered the oversold level.
It's important to note that these conditions are just a starting point for further analysis and should not be used alone to make investment decisions. Just because a security is overbought or oversold does not necessarily mean that a reversal will occur, and an overbought or oversold position can persist for an extended period of time. Additionally, these conditions can be subject to false signals, especially in range-bound markets or during periods of low volatility.
As a result, technical analysis should be used in conjunction with other forms of analysis, such as fundamental analysis and market sentiment, to form a comprehensive investment strategy. Additionally, it's always best to use multiple indicators and analysis techniques to confirm a potential trend change or to validate a trading signal.
How is RSI calculated?
RSI = 100 - (100 / (1 + (Average Gain / Average Loss)))
Where "Average Gain" is calculated as the sum of all positive price changes over the specified time period divided by the number of periods, and "Average Loss" is calculated as the sum of all negative price changes over the specified time period divided by the number of periods.
RSI is typically calculated using 14 periods, but this can be adjusted to suit the individual trader's needs. Additionally, the RSI can be applied to various types of securities, including stocks, cryptocurrencies, and commodities.
The RSI is a widely used momentum oscillator that provides traders with a simple and straightforward way to identify potential overbought and oversold conditions in an asset's price, as well as potential trend reversals. However, it's important to remember that the RSI should not be relied on solely for investment decisions and should be used in conjunction with other analysis techniques to form a comprehensive investment strategy.
What is RSI Divergence?
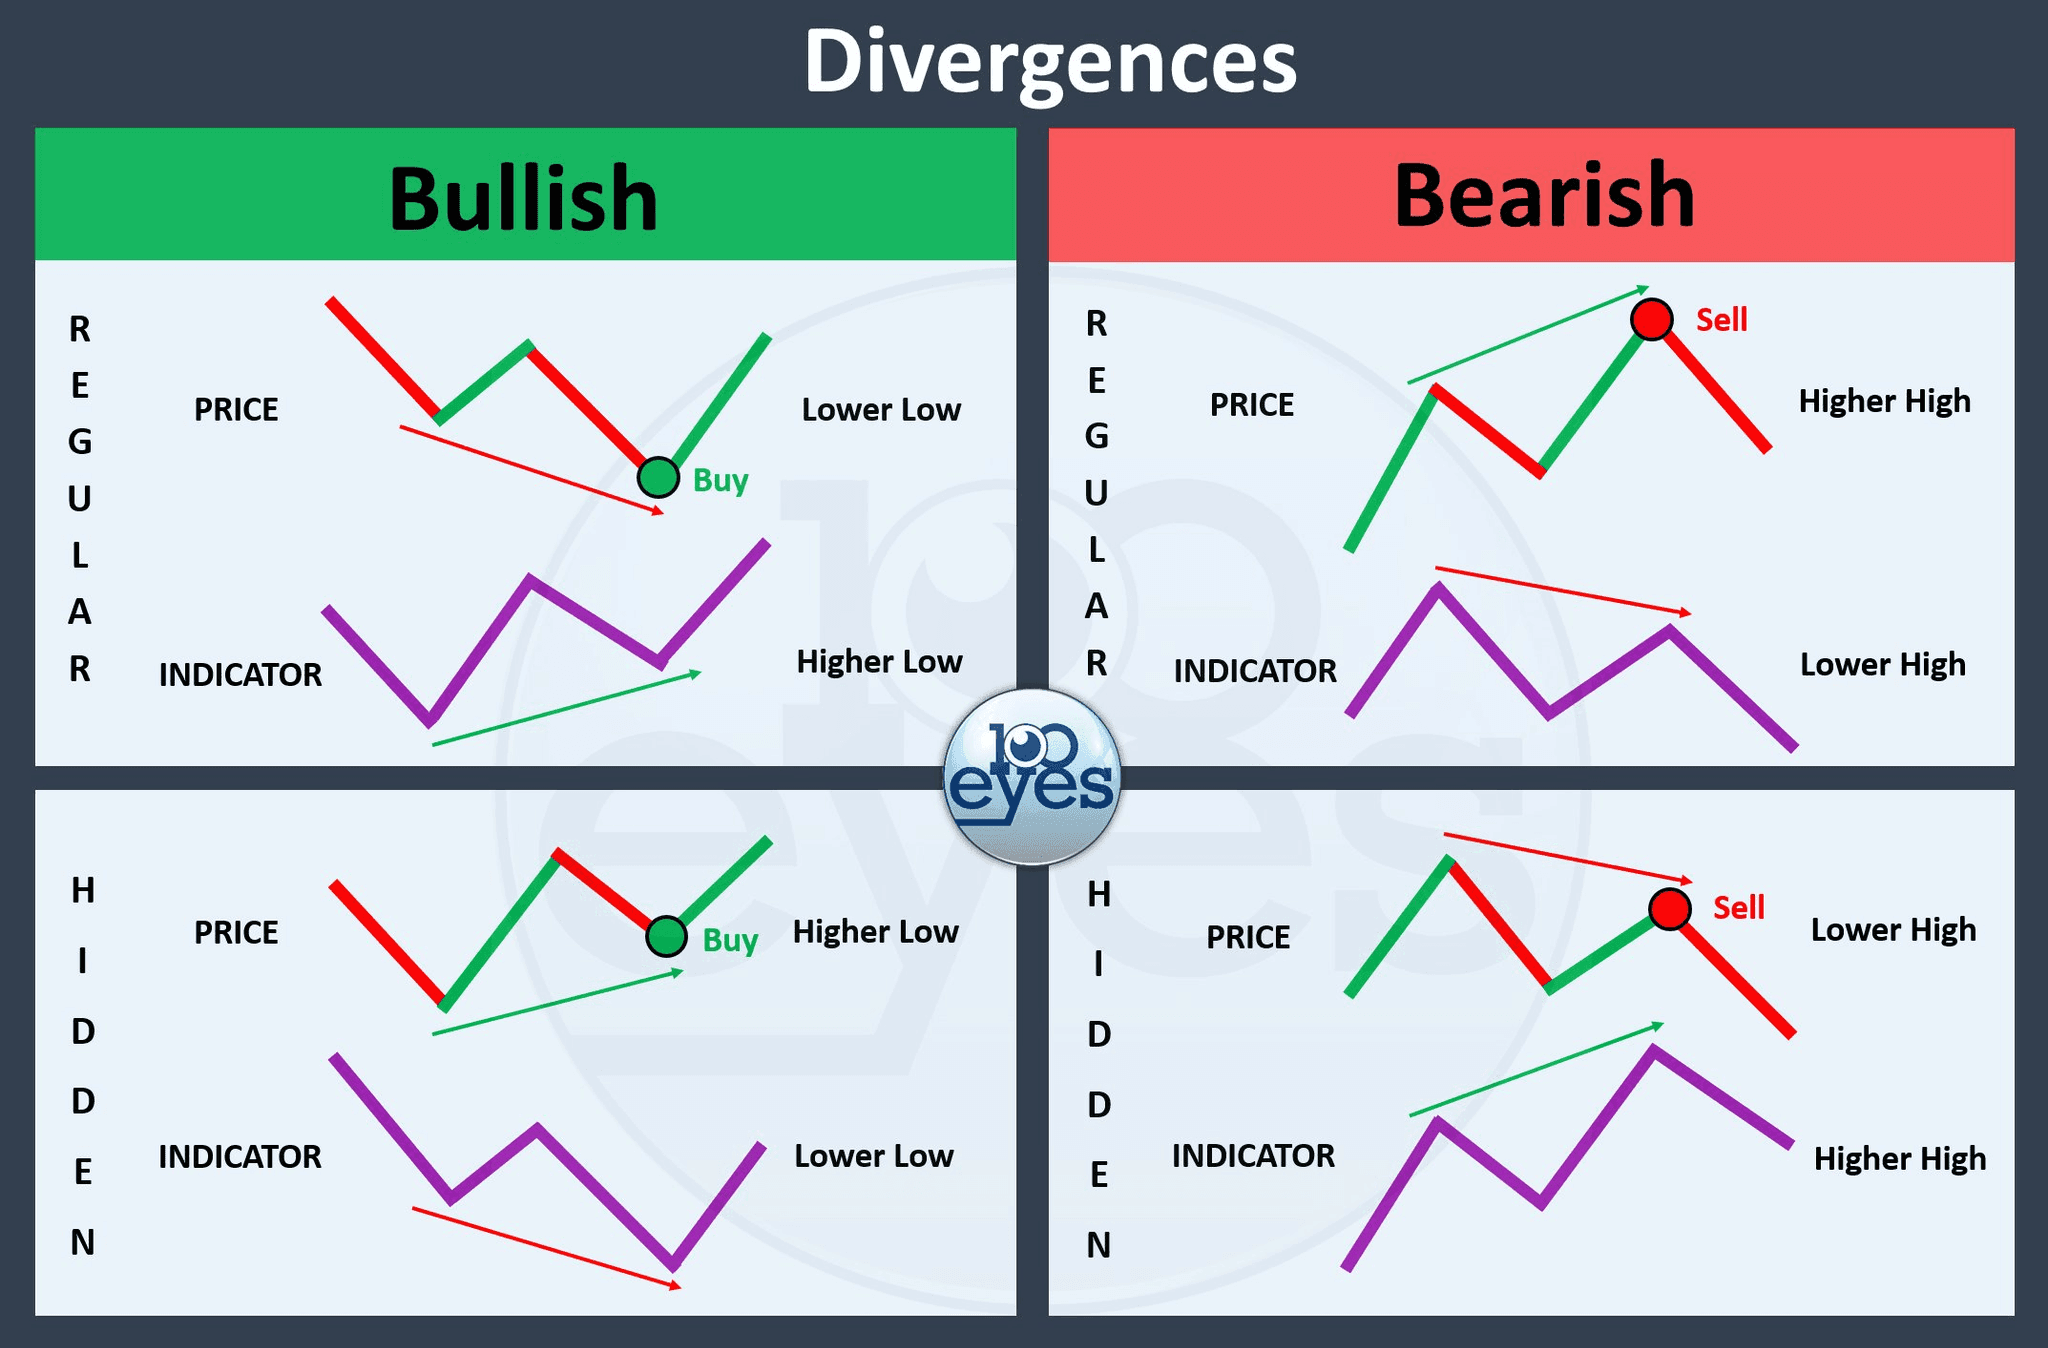
RSI Divergence is a technical analysis concept that refers to a disagreement between the direction of the price action of a security and the direction of the RSI. In other words, it occurs when the price of a security is making a new high or low, but the RSI is not confirming this move by also making a new high or low. This can be an early warning sign of a potential trend reversal, and traders will often look for RSI Divergence as a confirmation of a potential trend change.
There are two types of RSI Divergence: bullish divergence and bearish divergence.
**Bullish Divergence **occurs when the price of a security is making new lows. Still, the RSI is making higher lows, indicating that the selling momentum is weakening and a potential trend reversal to the upside may occur.
**Bearish Divergence **occurs when the price of a security is making new highs. Still, the RSI is making lower highs, indicating that the buying momentum is weakening and a potential trend reversal to the downside may occur.
RSI Divergence is just one tool in a trader's arsenal and should not be relied on solely for investment decisions. Technical analysis should be used in conjunction with other forms of analysis, such as fundamental analysis and market sentiment, to form a comprehensive investment strategy. Additionally, RSI Divergence can be prone to false signals, so it's always best to use multiple indicators and analysis techniques to confirm a potential trend change.
Disadvantages of the RSI
The Relative Strength Index (RSI) is a widely used technical analysis indicator, but like any indicator, it has its limitations. Some of the main limitations of the RSI include:
- **Overbought/Oversold levels are not fixed: **The overbought level of 70 and the oversold level of 30 are widely used, but these levels are not fixed and can vary depending on the security being analyzed.
- False Signals: The RSI can give false signals, especially in range-bound markets or during periods of low volatility.
- **Lags Price Action: **The RSI is a momentum oscillator and is therefore prone to lag behind price action, meaning that it may not provide a timely signal of a trend reversal.
- Limited to Price Data: The RSI is based solely on price data and does not take into account other fundamental factors that can impact a security's price, such as economic data releases or company-specific news.
- Subjectivity: The interpretation of the RSI can be subjective, and different traders may use different timeframes and calculation methods, leading to different conclusions.
RSI is just one tool in a trader's arsenal and should not be relied on solely for investment decisions. Technical analysis should be used in conjunction with other forms of analysis, such as fundamental analysis and market sentiment, to form a comprehensive investment strategy. Additionally, it's always best to use multiple indicators and analysis techniques to confirm a potential trend change or to validate a trading signal.
Conclusion
You shouldn't exclusively rely on the Relative Strength Index (RSI) to make decisions. Remember that the RSI doesn't always function. Therefore, adding more indicators to corroborate your trading decisions is helpful.
Successful traders employ indicators like the Moving Average Convergence Divergence (MACD), Simple and Exponential Moving Averages, and many others to confirm RSI signals.
For day traders, the Relative Strength Index (RSI) is strong. However, the outcome is never guaranteed, so don't place too much reliance on it. RSI predictions are based on historical data and have little to do with the present or future.
If you aspire to become a pro-crypto trader, then you have clicked at the right place. CoinScreener.ai advanced technical analysis and AI-generated signals, rich data sources from more than 1000 Future & Spot markets enriched by Machine Learning, and major cryptocurrency exchanges in the world to screen for market trading signals, monitor and analyze the trading behavior of Whales, Top Traders to identify the best market trends in real-time and make the most profit from your trade today.
Follow CoinScreener: https://linktr.ee/coinscreener.ai
#coinscreener #coin #screener #coinscreener.ai #crypto #ai #cryptosignals #cryptocoin #token #cryptoscreener #screenerapp #screenertool #tradingsignals #aitradingsignals #technicalanalysisscreener #technicalanalysis #tradingbot #cryptohopper #cryptobot #dcabot #robot #calculatorcrypto #btc #binance #liquidations #fundingrate #cryptoscreener #btcliquidation #cryptoliquidation #Liquidation #future #futuretrading #cryptocalculator #costbasic #fed #FOCM #Federalreserve #CEX #DEX #KYC #RSI #indicator