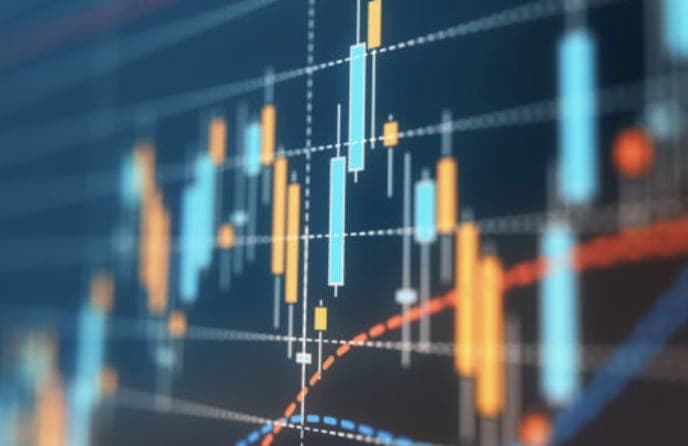
Japanese candlestick charts are a popular tool in the technical analysis used by traders to track the price movements of assets, including cryptocurrencies. These charts provide valuable insights into market sentiment, allowing traders to identify trends, support and resistance levels, and potential trading opportunities.
In this article, we will explore how to read and use Japanese candlesticks in crypto trading.
Understanding Japanese Candlesticks
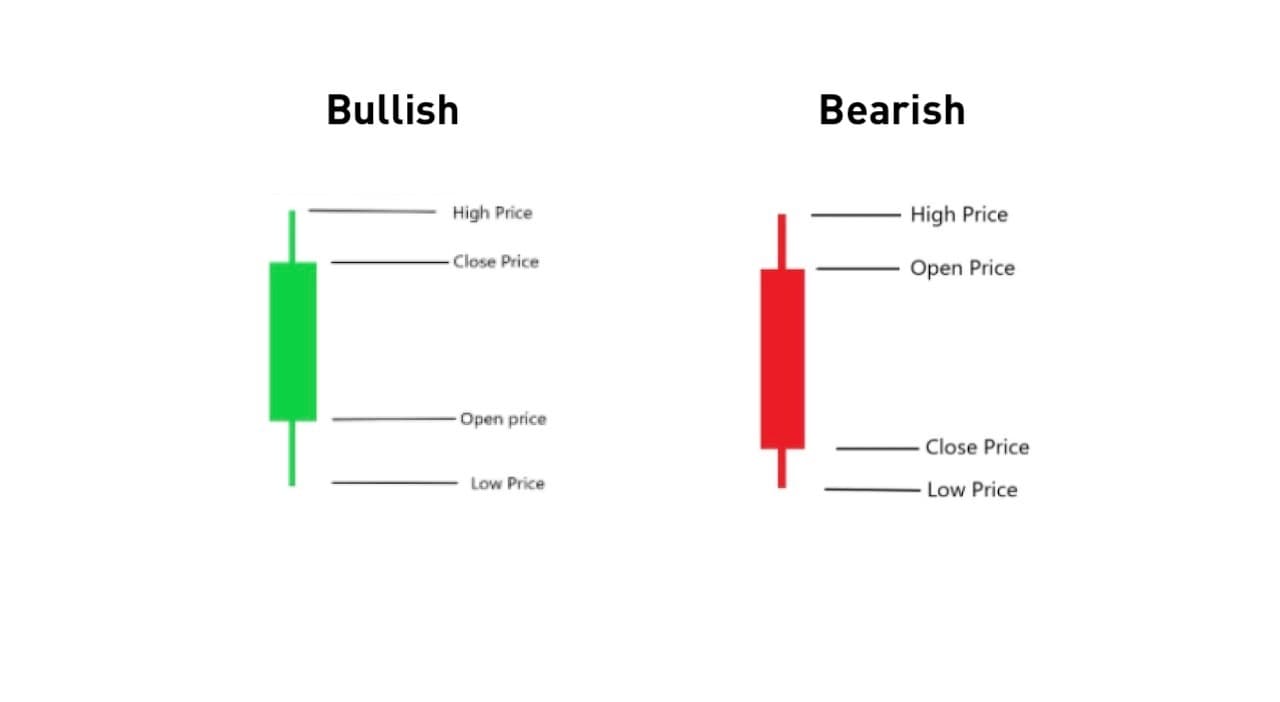
Japanese candlesticks consist of four key components: the opening price, the closing price, the highest price, and the lowest price. Each candlestick represents a specific time period, such as one minute, five minutes, or one day. A green candlestick indicates a price increase, while a red candlestick indicates a price decrease.
Identify Trend
Traders can use candlestick charts to identify the trend of an asset. A bullish trend is characterized by a series of consecutive green candlesticks, while a bearish trend is characterized by a series of consecutive red candlesticks. By identifying the trend, traders can make informed decisions about when to enter or exit a trade.
Determine Support and Resistance Levels
Candlestick charts can also help traders identify support and resistance levels. Support levels represent a price level at which buyers are likely to enter the market, while resistance levels represent a price level at which sellers are likely to enter the market. These levels can be identified by looking at areas where the price has repeatedly bounced off a particular price point.
Recognize Candlestick Patterns
Candlestick patterns provide insights into market sentiment and can help traders make informed decisions about when to enter or exit a trade. There are several types of candlestick patterns, including bullish engulfing, bearish engulfing, hammer, hanging man, and doji. These patterns can be used in conjunction with other technical indicators to confirm trading decisions.
Use Multiple Time Frames
Traders can use multiple time frames to gain a better understanding of the market sentiment. For example, a trader may use a 5-minute chart to identify short-term trends and a 1-hour chart to identify long-term trends. By using multiple time frames, traders can get a more comprehensive view of the market sentiment.
Typical Mistakes Made When Trading with Japanese Candlesticks
While candlestick analysis can provide valuable insights into market sentiment and help traders make informed decisions, there are some common mistakes that traders make when using Japanese candlesticks. In this article, we will discuss some of these mistakes and how to avoid them.
- Focusing Too Much on Individual Candlesticks One common mistake traders make is focusing too much on individual candlesticks without considering the bigger picture. While individual candlesticks can provide useful information, it is important to look at the overall trend and consider the context in which the candlesticks are occurring. Traders should also use multiple time frames to get a more comprehensive view of the market sentiment.
- Overcomplicating Analysis Another mistake traders make is overcomplicating their candlestick analysis by using too many indicators or trying to identify every single candlestick pattern. While it is important to have a solid understanding of candlestick patterns and technical indicators, using too many can lead to confusion and make it difficult to make well-informed trading decisions. It is best to focus on a few key indicators and patterns that have been proven to be effective.
- Ignoring Fundamental Analysis Candlestick analysis should not be used in isolation, and traders should also consider fundamental analysis when making trading decisions. Fundamental analysis involves analyzing the underlying financial and economic factors that affect an asset's value. This can include factors such as company news, economic indicators, and geopolitical events.
- Failing to Manage Risk Finally, one of the biggest mistakes traders make is failing to manage their risk effectively. This can include not setting stop-loss orders, not diversifying their portfolio, or trading with too much leverage. It is important to have a solid risk management strategy in place to protect your capital and prevent significant losses.
By focusing on the bigger picture, using a few key indicators and patterns, considering fundamental analysis, and managing risk effectively, traders can increase their chances of success in the markets.
Conclusion
Japanese candlestick charts are a valuable tool for crypto traders, providing insights into market sentiment, identifying trends, and determining support and resistance levels. By understanding how to read and use Japanese candlesticks, traders can make informed trading decisions and increase their chances of success. It is important to note that candlestick analysis should be used in conjunction with other technical indicators and fundamental analysis to make well-informed trading decisions.
If you aspire to become a pro-crypto trader, then you have clicked at the right place. Coinscreener is a trading tool platform that provides crypto traders, especially crypto newbies to screen trading signals on markets, follow, and analyze the trading behavior of Whales, Top Traders to identify the best market trends and make the most profits out of their trades.
Follow CoinScreener: https://linktr.ee/coinscreener.ai
KEY FEATURES:
📈 1. Trading Signals:
Maximize your trading opportunities with signals produced through advanced technical analysis & AI algorithms.
📊 2. Top Trader Alerts:
Follow top traders and get notified when they open, close, or adjust their positions.
🐳 3. Whale Alerts:
Get alerted of large buys/sells and track the history of whale activities for 1000+ Future & Spot markets.
🙈 4. Unusual Activity Alerts
Get real-time alerts on market pumps & dumps and unusual volume activities.
#coinscreener #coin #screener #coinscreener.ai #crypto #ai #cryptosignals #cryptocoin #token #cryptoscreener #screenerapp #screenertool #tradingsignals #aitradingsignals #technicalanalysisscreener #technicalanalysis #tradingbot #cryptohopper #cryptobot #dcabot #robot #calculatorcrypto #btc #binance #liquidations #fundingrate #cryptoscreener #btcliquidation #cryptoliquidation #Liquidation #future #futuretrading #cryptocalculator #Candlesticks